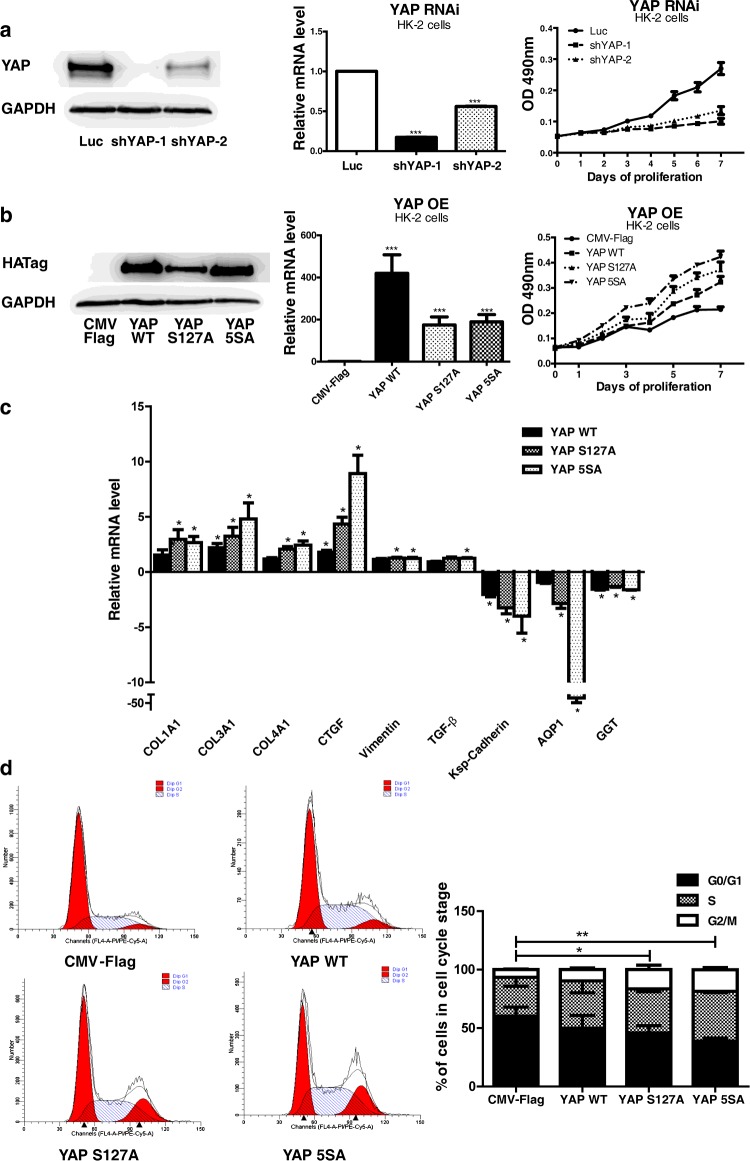
Figure 4. Analysis of YAP overexpression and RNAi in HK-2 cells.
(a) YAP RNAi slowed the proliferation of HK-2 cells. Results are means±S.E.M. (b) YAP overexpression (OE) promoted the proliferation of HK-2 cells. Results are means±S.E.M. (c) Quantification of mRNA levels of pro-fibrogenic and differentiation genes in YAP-overexpressing HK-2 cells. The mRNA levels are presented as mean±S.E.M. fold induction over the empty vector-transfected control. *P<0.05 compared with control. (d) Cell cycle analysis through propidium iodide staining of YAP-overexpressing HK-2 cells. Results in the histogram are means±S.E.M. For comparison of G2/M phases, *P<0.05 compared with control; **P<0.01 compared with control. CMV, cytomegalovirus; WT, wild-type.

