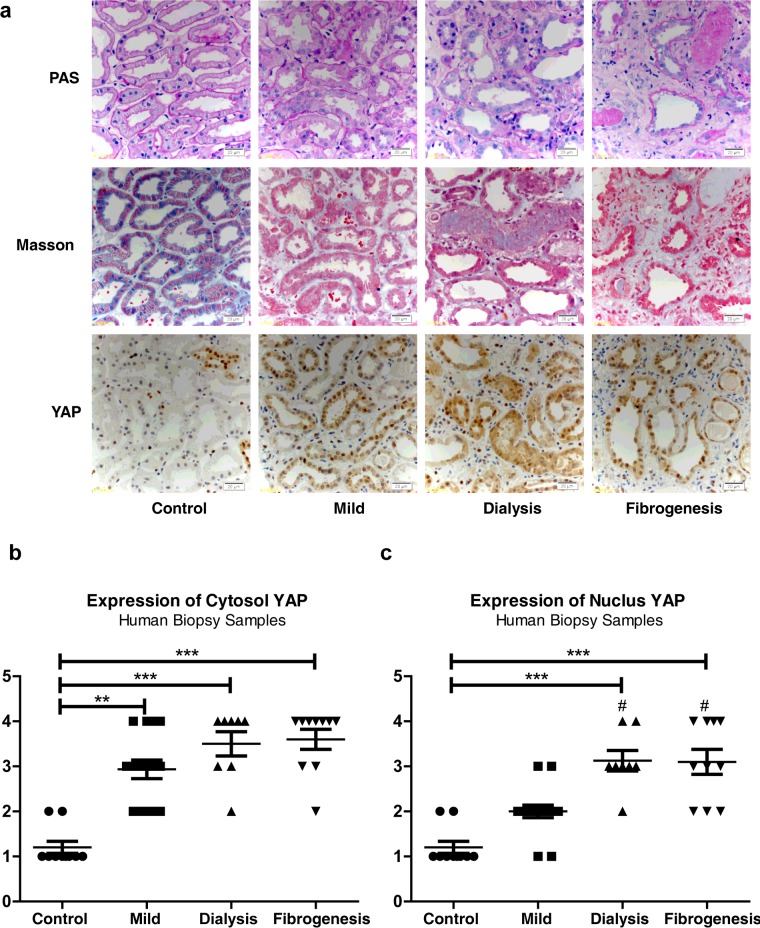
Figure 6. Pathological features and YAP immunostaining in AKI human biopsy samples.
(a) PAS staining (×400 magnification) showing morphology changes in AKI groups. Scale bar, 20 μm (top). Masson's trichrome staining (×400 magnification) showing fibrosis as blue appearance. Scale bar, 20 μm (middle). YAP immunostaining (×400 magnification). Scale bar, 20 μm (bottom). (b) Cytosolic and nuclear YAP expression in different AKI groups compared with controls. **P<0.01 compared with control; ***P<0.001 compared with control; #P<0.05 compared with mild-regenerating group.

