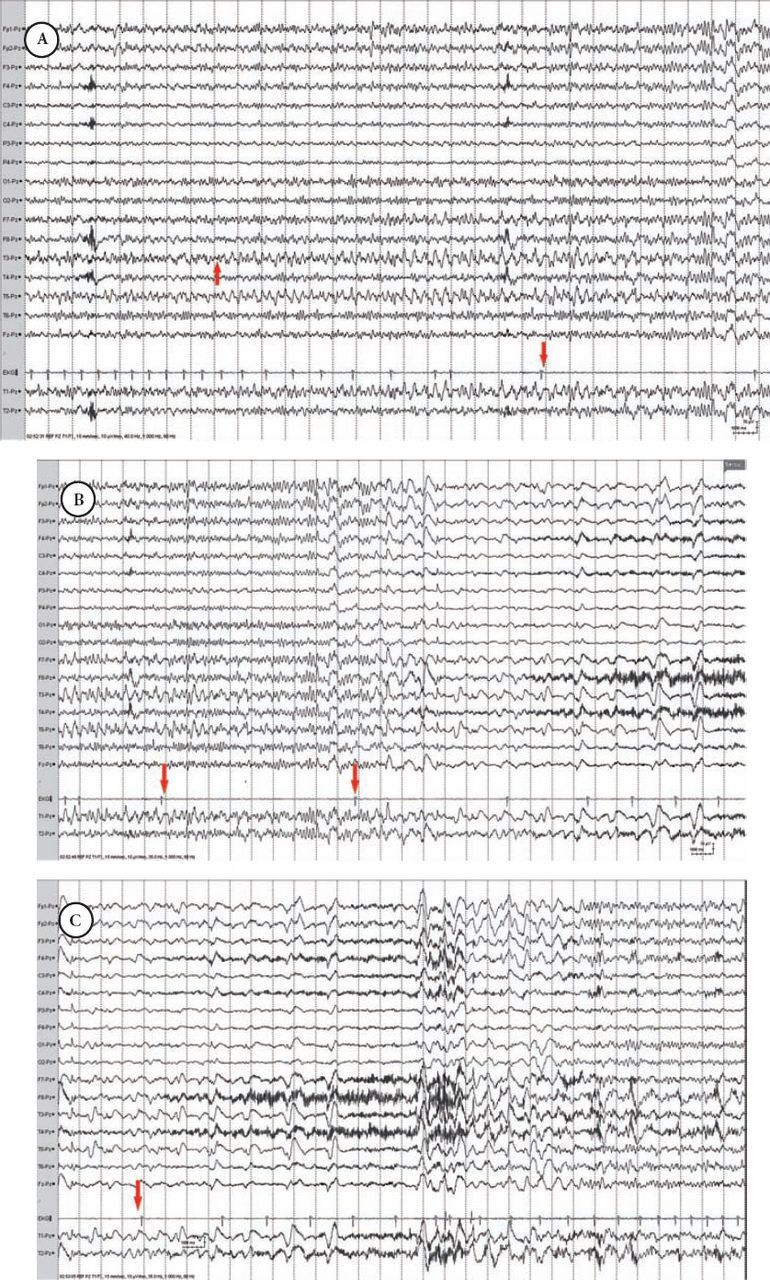
Figure 2.

Ictal asystole in patient 2 showing: A) Left mid temporal ictal discharge onset (up arrow) followed by bradycardia and ictal asystole (down arrow). B) Ictal asystole (arrows) associated with EEG voltage attenuation. C) Termination of ictal asystole followed by recovery of the EEG activity (arrow).
