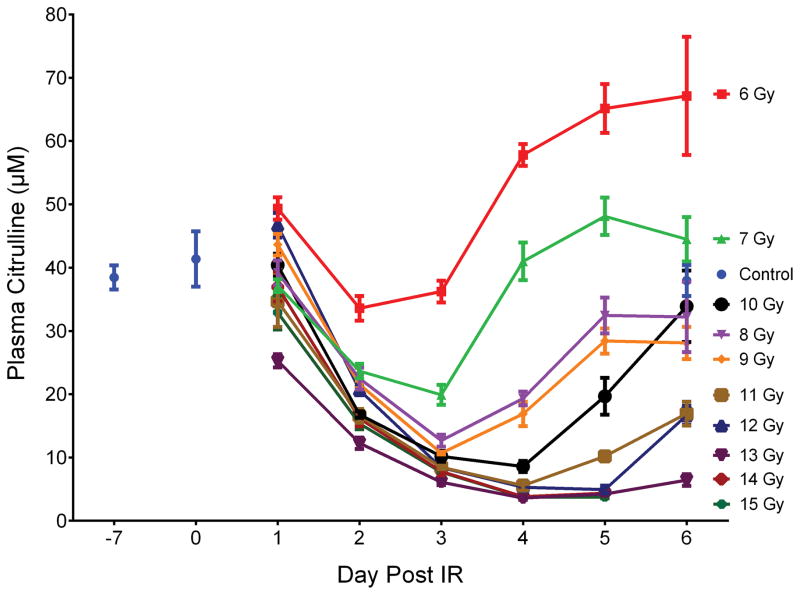
Fig. 1.
Plasma citrulline expressed as a function of day post IR. Day −7 corresponded to plasma samples from age-matched non-irradiated control mice 7 days prior to IR. Day 0 corresponded to plasma samples from age-matched non-irradiated control mice just prior to IR. Plasma samples for day 6 at 14 and 15 Gy were not accessible due to euthanasia criteria and were sampled on day 5. Concentrations were expressed in μM as mean ± sem. Refer to Table S2 for tabulated values for concentrations, error, and number of independent plasma samples.

