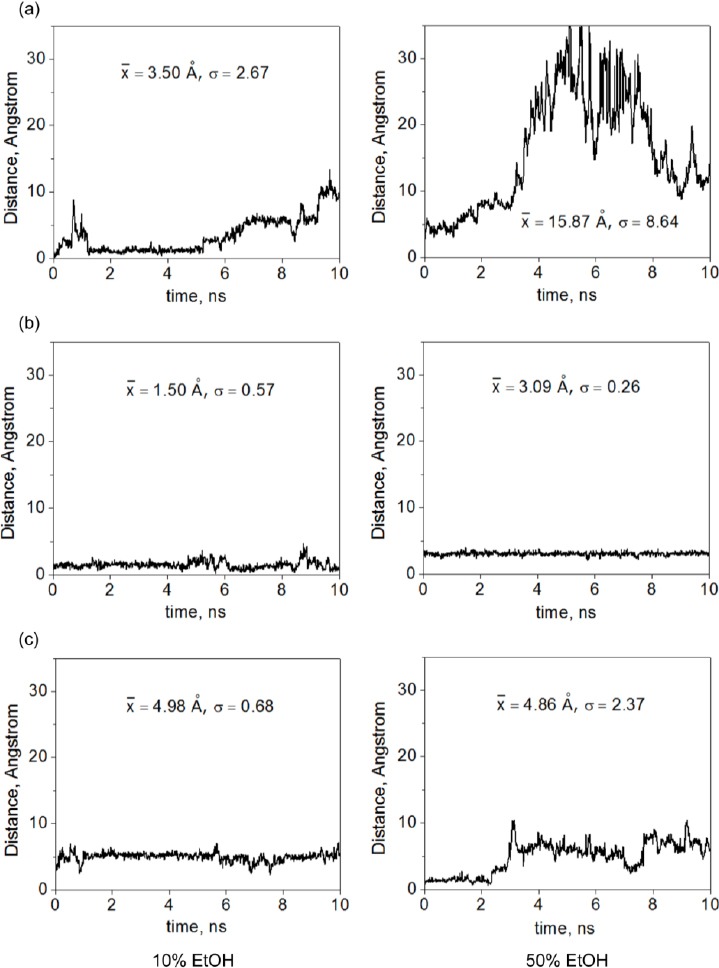
Fig. 2.

Distances between the centers of mass of UC781 and CD molecules of (a) UC781/βCD, (b) UC781/MβCD, and (c) UC781/HPβCD inclusion complexes in 10% and 50% ethanol solutions x̄ is the average distance and σ is the corresponding standard deviation.
