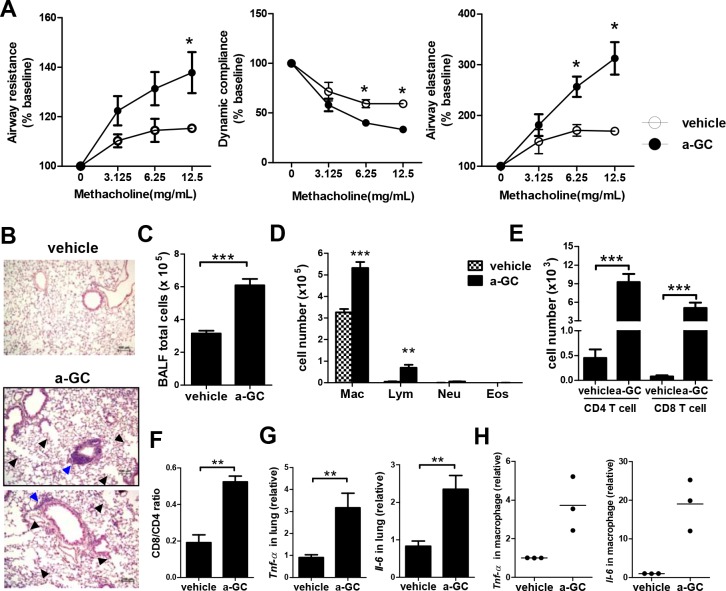
Fig 3. Increased airway inflammation in mice repeatedly administered with α-GalCer.
Mice received intranasal α-GalCer administration once a week for 6 weeks and airway inflammation was measured 2 weeks after the last administration. (A) Analysis of lung function. Changes in airway resistance, dynamic compliance, and airway elastance were measured on mechanically ventilated mice, in response to increasing doses of methacholine. (B) Representative results of H-E examination of lung sections (x100 magnification). Blue arrowheads indicate cell infiltration in the lung. Black arrowheads indicate airspace enlargement in the lung. (C) The total numbers of cells present in BALF. (D) The absolute numbers of macrophages, lymphocytes, neutrophils, and eosinophils, present in BALF. Mac, macrophage; Lym, lymphocyte; Neu, neutrophil; Eos, eosinophil. (E) The absolute numbers of CD4+ and CD8+ T cells were examined. (F) CD8/CD4 ratios of T cells were measured. (G) Lung tissues were isolated and the expression of TNF-α and IL-6 was detected by quantitative RT-PCR. n = 9–14 mice for each group. (H) Macrophages from BALF were isolated and their expression of TNF-α and IL-6 was detected by quantitative RT-PCR. Individual symbols represent a sample pooled from 3–5 mice and the horizontal lines represent the mean values. a-GC, α-GalCer. *, p<0.05; **, p<0.01; ***, p<0.001 using Mann-Whitney U test.

