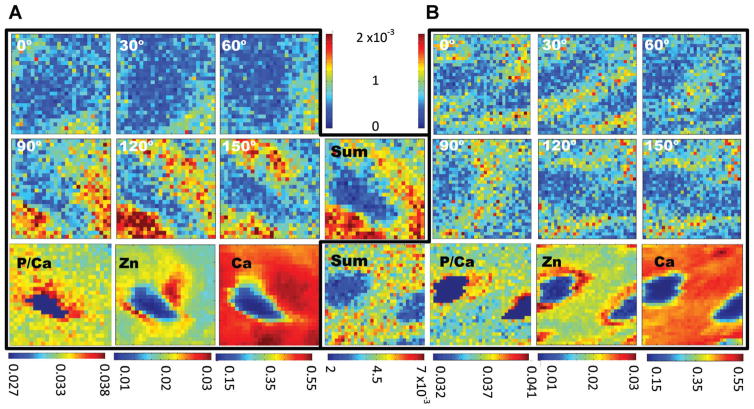
Fig 2.
Texture and fluorescence maps for two of the area scans covering 6 μm × 6 μm. The texture maps (top six maps in A and B) are plots of 00.2 diffraction intensity at the specified azimuthal orientation (±15°) as a function of position. The scale (shown in the top center) is the diffraction intensity normalized to the incident beam intensity, and maps of the total (“sum”) of diffracted intensity appear in the center below the intensity color bars. The scale below the sum maps is the total diffraction intensity normalized to the incident beam intensity. The ratio of phosphorous-to-calcium fluorescence intensities is shown in the bottom left. The Zn and Ca fluorescence intensities are shown to the center and left of the bottom row. The scales, shown below the maps, are fluorescence intensities normalized to the incident beam intensity.

