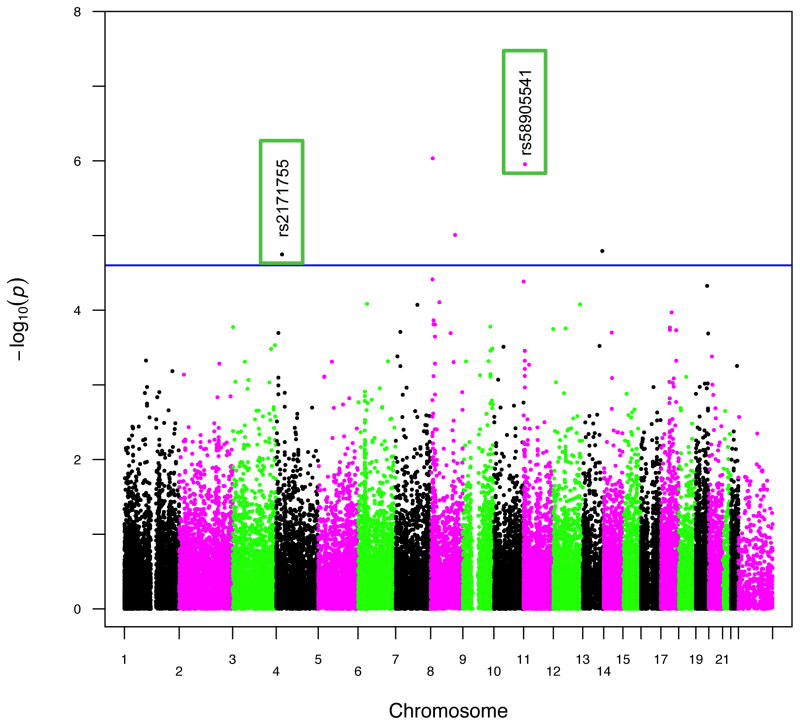
Figure 1. Manhattan plot for prepulse phenotype.
Manhattan plot across all chromosomes, using covariates age and gender. Minor allele frequency cutoff of 0.01 applied to the plot. Suggestive significance line calculated from GEC software. Green rectangles in plot highlight SNPs rs2171755 and rs58905541.

