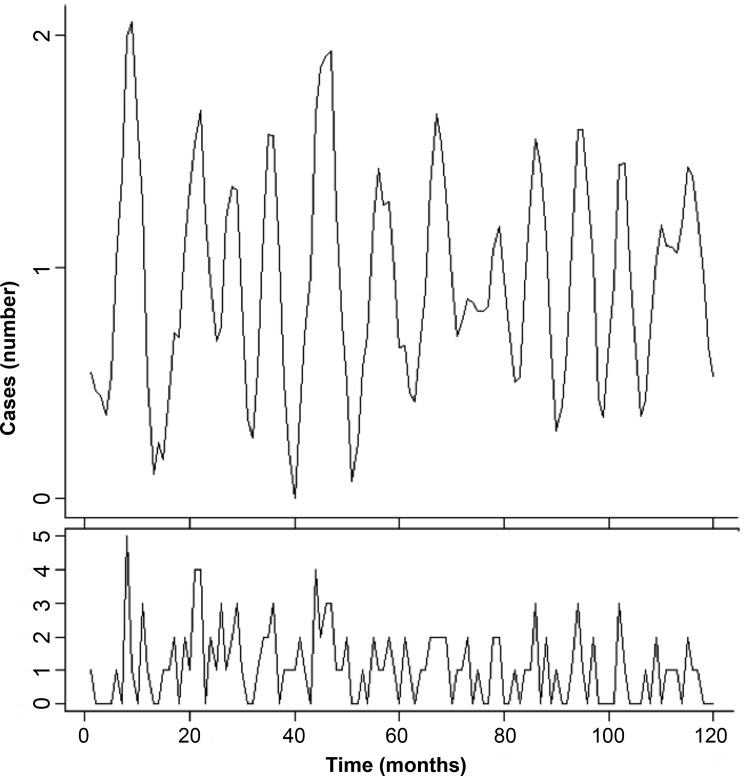
Fig 2. Time series of nontuberculous mycobacterial lymphadenitis and skin and soft tissue infections combined over the study period.
The lower plot shows the raw data; the upper plot shows the 3rd level denoised data. Denoising was performed using a discrete wavelet transform with Daubechies length 6 wavelet filter.

