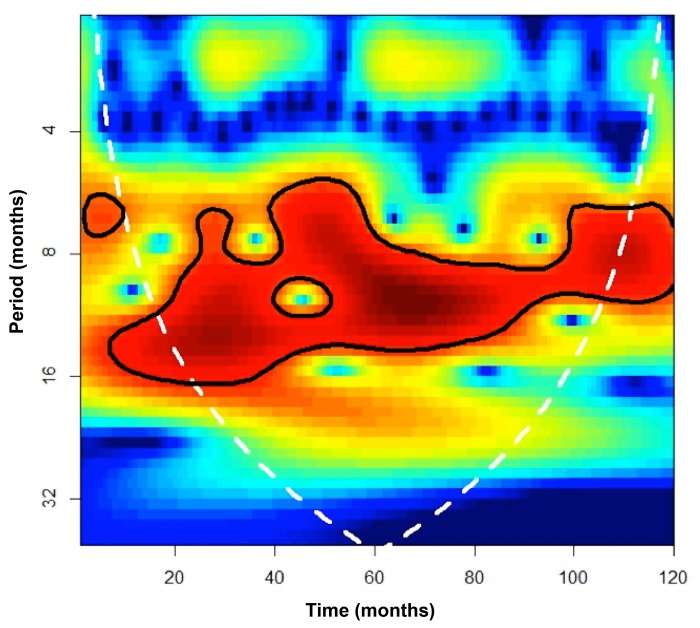
Fig 3. Power spectrum obtained from a continuous wavelet transform based on a Morlet wavelet filter for the detrended and denoised time series of nontuberculous mycobacterial lymphadenitis and skin and soft tissue infection cases combined.
The graph shows the power for each period or cycle (y-axis) along the time series (x-axis). High values are shown in dark-red and low values in dark-blue. The dark line contains the statistically significant periods (p<0.05); the white line is the cone of influence that delimits the area not influenced by edge-effects.

