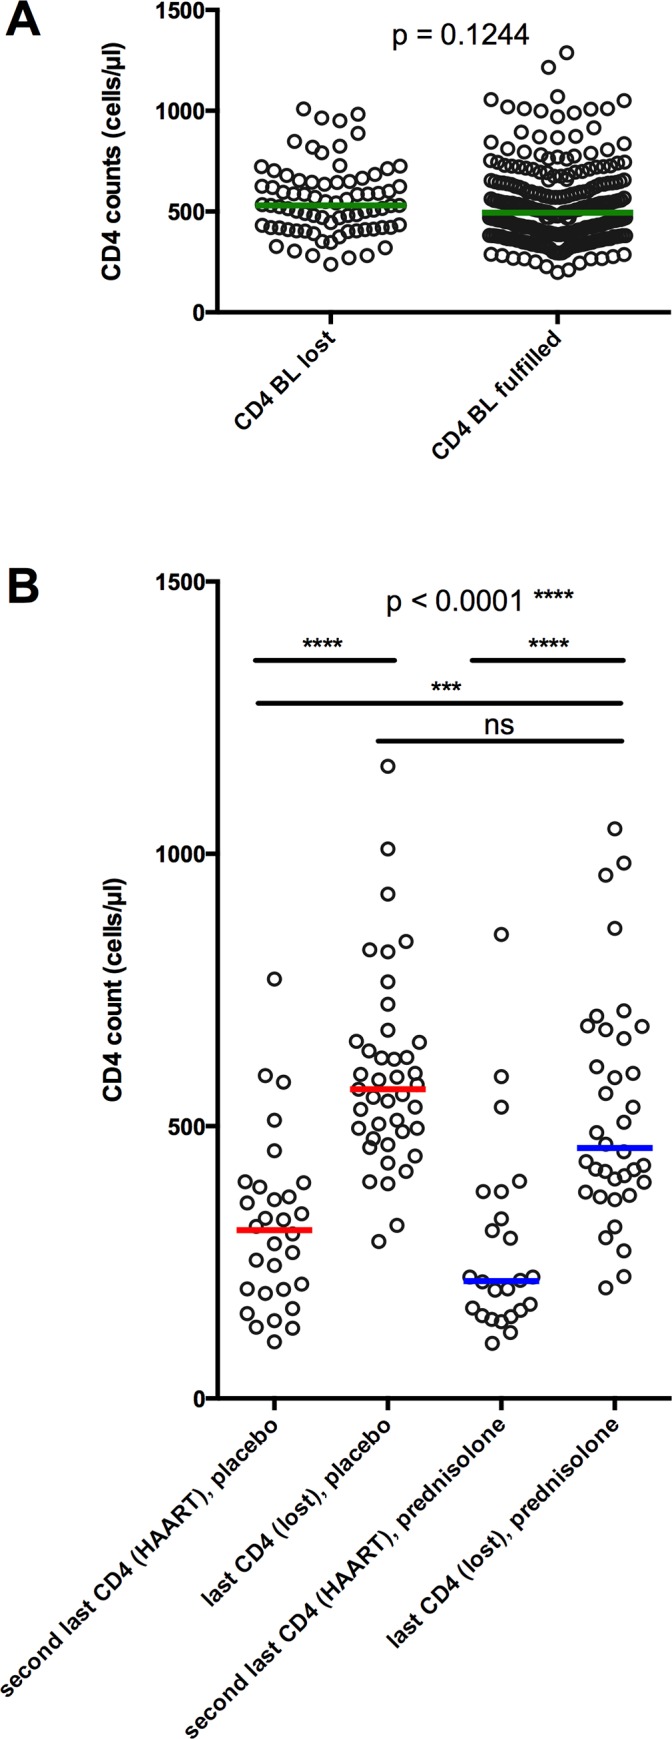
Fig 3. CD4 counts of study participants with loss of follow-up.

A: Baseline (BL) CD4 counts from study participants who were later lost to follow up (lost) and who fulfilled (fulfilled) the study. P value was calculated by Mann-Whitney test. B: CD4 counts prior to loss to follow up (loss) or to progression to the primary endpoint (HAART). Red bars (placebo) and blue bars (prednisolone) represent medians. P values were calculated by Kruskal-Wallis test with multiple comparisons.
