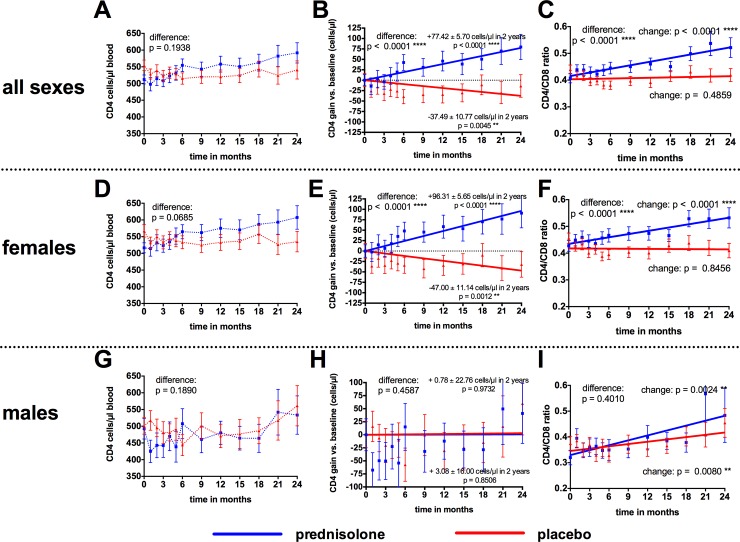
Fig 8. Effects of prednisolone on CD4 counts and CD4/CD8 ratio.
A: Mean CD4 ± S.D. P-values were determined by 2way ANOVA. B: Mean CD4 changes ± S.D. relative to baseline and linear regression of the data. 2-year gains/losses were calculated from slope of linear regression. C: Mean ± S.D. CD4/CD8-ratio and linear regression. B, C: P values on the right indicate non-zero hypotheses for the slope. P-value on the left for difference between the two data sets was calculated by 2way ANOVA. D-F and G-I: Post-hoc analyses for female study participants (D-F) and for male study participants (H-I) for absolute CD4 counts (D, G), CD4 relative CD4 changes (E, H), and CD4/CD8 ratio (F, I).

