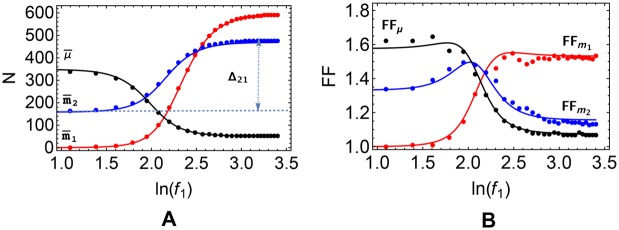
Fig 2. Cross-talk scenario in the ceRNA network.
Steady state values of (A) the ceRNA and miRNA levels, and (B) the corresponding Fano factors. Markers denote GA computations, curves correspond to approximate analytical solutions obtained by the linear noise approximation. Values of the kinetic parameters are reported in Table 1.

