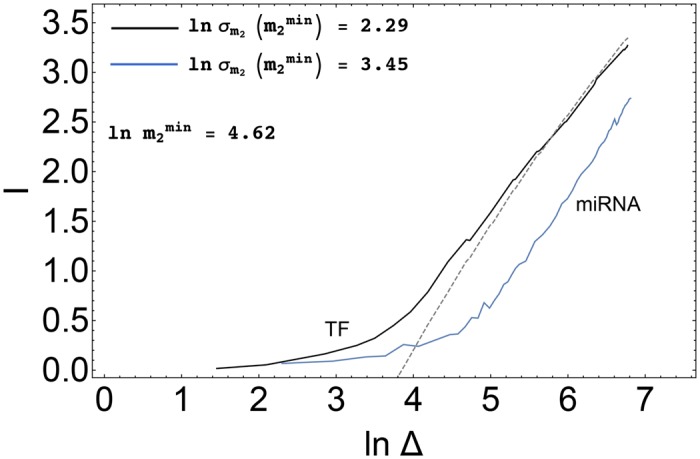
Fig 8. Channel capacities as a function of the target’s degree of derepression (AOV).

The black curve corresponds to direct transcriptional control in absence of miRNAs, while the blue curve describes the behavior of the miRNA-mediated post-transcriptional channel. For both channels . The predicted maximal MI in the Poissonian limit given in S1 Text is shown as a dashed line. Values of the kinetic parameters are reported in Table 1.
