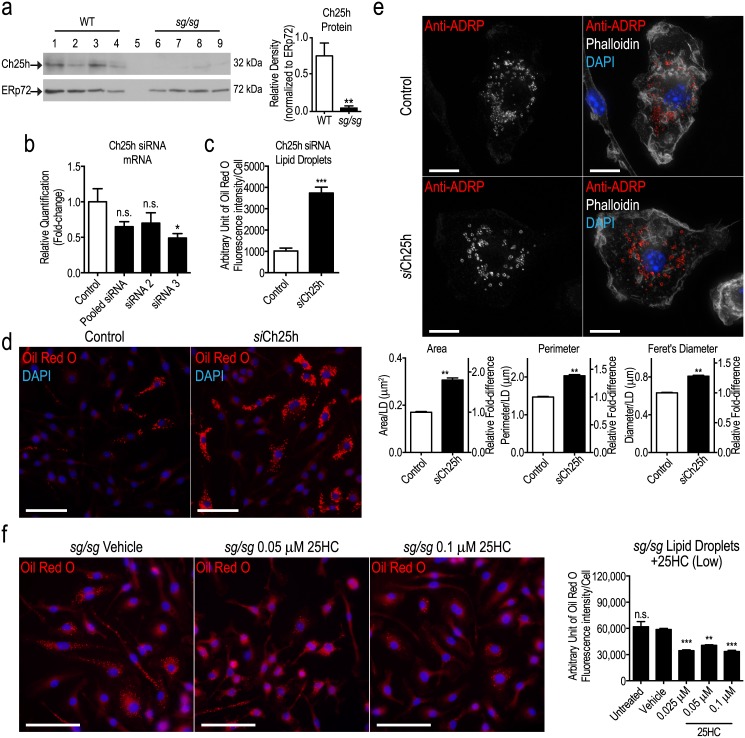
Fig 3. Ch25h knockdown up-regulates LDs.
(a) Western blot analysis of Ch25h protein in WT (lanes 1 to 4) and sg/sg (lanes 6 to 9) BMMs (n = 4 littermate pairs). Lane 5 was only loaded with sample buffer. Quantification was performed by normalizing the relative densities of Ch25h bands (32 kDa) to the loading control ERp72 (72 kDa) and is represented as the mean ± S.E.M. relative density from n = 4 littermate pairs. Statistical analysis was performed using an unpaired two-tailed Student’s t-test where **P<0.01. (b) Two separate siRNA oligomers (individually or pooled) were used to knockdown expression of Ch25h in WT BMMs. The degree of mRNA knockdown was assessed by qPCR in unactivated macrophages with Hprt1 as the housekeeping gene and represented as the mean ± S.E.M relative quantification (fold-change) with WT cells treated with siRNA negative control set as 1.0. Statistical analysis was performed using a one-way ANOVA with Bonferroni’s post test applied, comparing Ch25h mRNA expression in all treatments relative to the siRNA negative control (n = 4 biological replicates) where *P<0.01; n.s. denotes non-significant. (c) Quantification of LDs in WT control and siCh25h BMMs is expressed as the mean ± S.E.M. fluorescence intensity (integrated density) of stained LDs (Oil Red O) normalized to number of cells analyzed (~500–700 cells per biological replicate (n = 4)). Statistical analysis was performed using an unpaired two-tailed Student’s t-test where ***P<0.001. (d) Representative images of LDs (stained using Oil Red O) in WT control and siCh25h BMMs. Images were taken using the Olympus upright wide-field epifluorescence microscope. Blue denotes nucleus (DAPI) labeling and red denotes LD (Oil Red O) labeling. Scale bars = 50 μm. (e) Representative images of anti-ADRP (red) labeling in WT control and siCh25h BMMs. Images were taken using the Personal Deltavision Deconvolution microscope and displayed as the maximum projection of 30-step z-stack (0.1 μm slices). White denotes actin (phalloidin) labeling and blue denotes nucleus (DAPI) labeling. Quantification of LDs was performed on 600–700 LDs acquired from 5 fields of view per biological replicate (n = 4 biological replicates) and is expressed as the mean ± S.E.M. cross sectional area, perimeter, and Feret’s diameter per LD. Statistical analyses were performed using unpaired two-tailed Student’s t-tests for each parameter where **P<0.01. Scale bars = 10 μm. (f) sg/sg BMMs treated with vehicle control (0.01% DMSO) or 25HC (0.025 μM to 0.1 μM) for 4 h. Representative images were taken using the Olympus upright wide-field epifluorescence microscope are shown on the left panel where blue denotes nucleus (DAPI) labeling and red denotes LD (Oil Red O) labeling. Quantification of LDs (low 25HC treatment) is expressed as the mean ± S.E.M. fluorescence intensity (integrated density) of stained LDs normalized to number of cells analyzed (n = ~100 cells per mouse per treatment). Statistical analysis was performed using a one-way ANOVA with Bonferroni’s post test (n = 3 biological replicates), comparing the amount of LDs in each treatment to the vehicle control sg/sg cells where **P<0.01; ***P<0.001; n.s. denotes non-significant. Scale bars = 50 μm.

