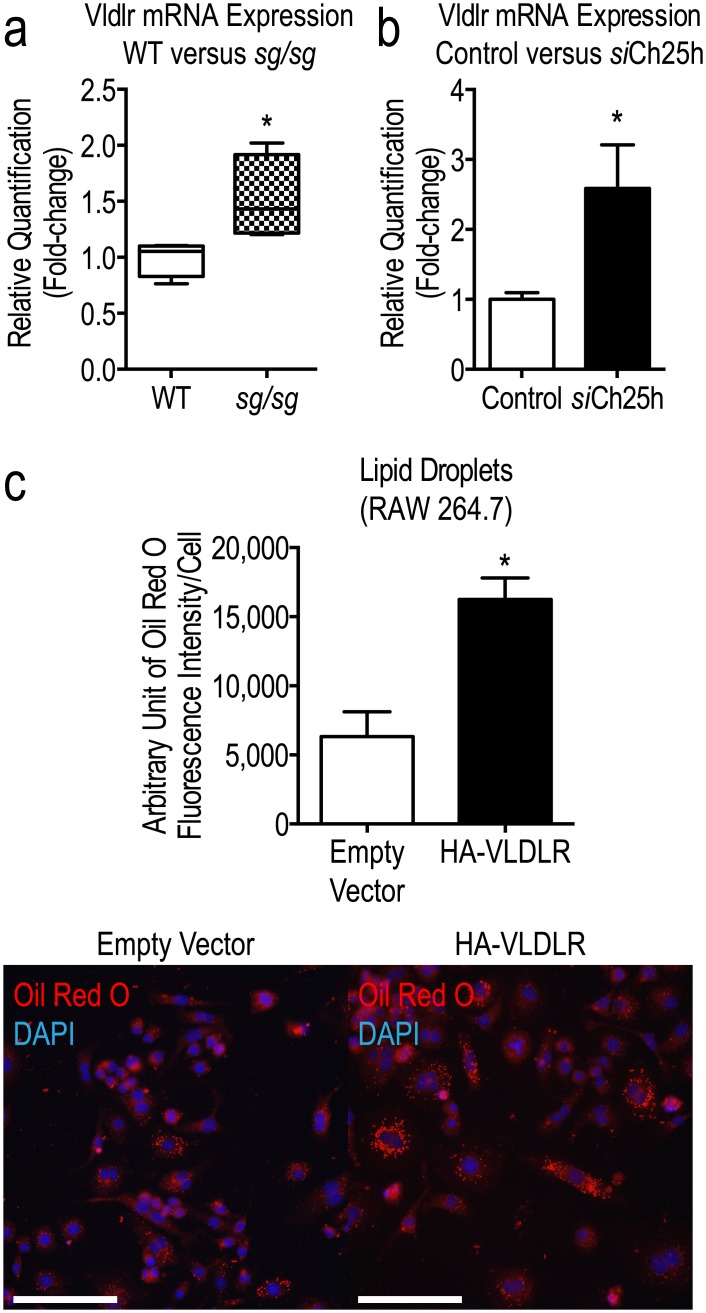
Fig 4. Increased Vldlr mRNA expression correlates with increased lipid uptake in sg/sg BMMs.
(a) Vldlr mRNA expression from Lipoprotein Signaling and Cholesterol Metabolism RT2 Profiler PCR Array (Qiagen) expressed as the mean ± S.E.M. relative quantification (RQ) (fold-change) in siCh25h cells (black bar) compared to control siRNA (set as 1.0; white bar). The Genorm software embedded in StatMiner determined Actb, Gapdh, and Hsp90ab1 to be the three most stable and robust endogenous controls and all data were normalized to the median of their Ct values. The P-values were calculated using empirical Bayes statistics where *P<0.05. (b) Targeted qPCR analysis was performed using Taqman Gene Expression Assays for Vldlr. Hprt1 was used as the endogenous control. Analysis was performed using RNA acquired from n = 4 littermate pairs of WT and sg/sg BMMs in triplicate experiments and represented as the mean ± S.E.M relative quantification (fold-change) with WT set as 1.0. Statistical analysis was performed using unpaired two-tailed Student’s t-test where *P<0.05; **P<0.01. (c) RAW264.7 cells were transiently transfected with either an empty HA-tagged pcDNA3.1 vector or a vector containing HA-VLDLR for 48 h. Cells were stained for LDs using Oil Red O and quantification of LDs is expressed as the mean ± S.E.M. fluorescence intensity (integrated density) of stained LDs normalized to number of cells analyzed (~350 cells per experiment, n = 3 independent experiments). Statistical analysis was performed using an unpaired two-tailed Student’s t-test where *P<0.05. Representative images of RAW264.7 cells transiently transfected with either an empty HA-tagged pcDNA3.1 vector or a vector containing HA-VLDLR for 48 h were captured using the Olympus upright wide-field epifluorescence microscope are shown in the bottom panel. Red denotes LDs (Oil Red O staining) and blue denotes nuclei (DAPI). Scale bars = 100 μm.

