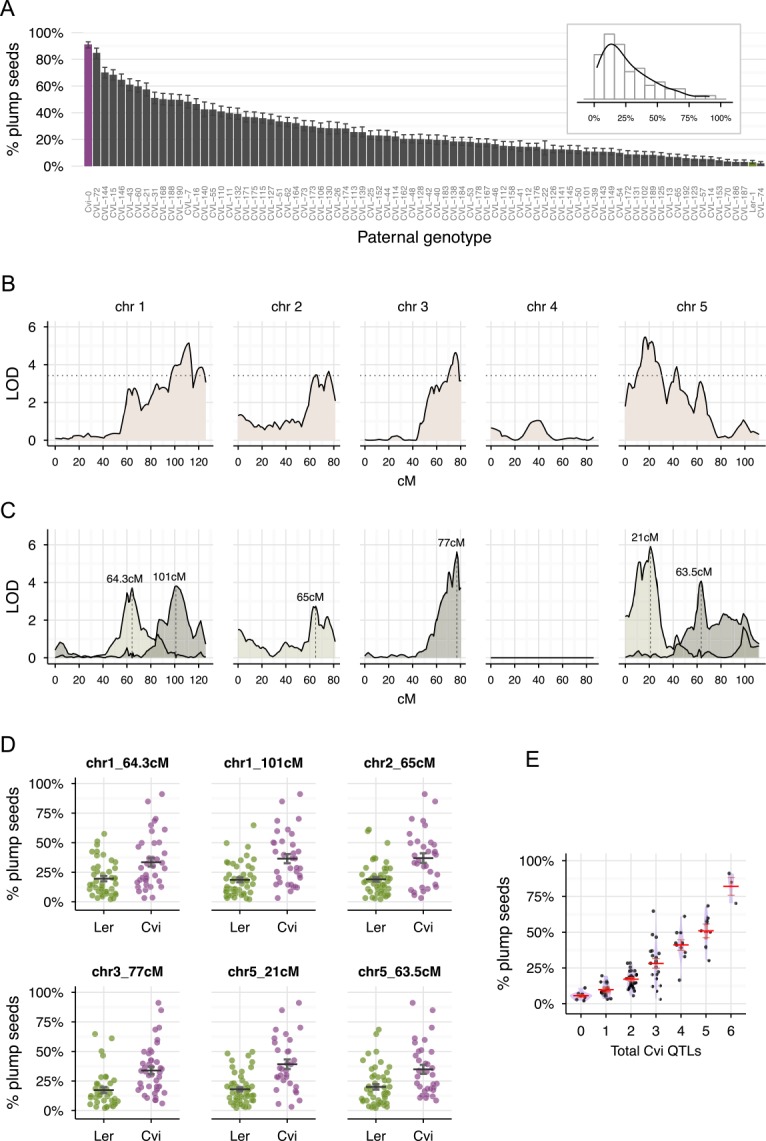
Fig 3. QTL analysis demonstrates that six loci contribute independently to mea seed rescue.

(A) Percentage of viable plump seeds derived from crosses between homozygous mea-1/mea-1 and pollen from a Ler/Cvi RIL population. Error bars indicate 95% binomial confidence intervals. The inset is a histogram representation of the same data. (B) Standard QTL interval mapping. The dotted line represents the 1% significance LOD threshold. (C) Bayesian estimates for the localization of each of the six QTLs from a multiple QTL model. The values above the peaks represent the best estimate for the localization of the QTL. (D) Effect of individual QTLs. In each subpanel the percentage of plump seeds of all the 80 RILs as in panel A are shown, but sorted according to the genotype (Cvi-0 or Ler) at the respective QTL. The black horizontal line and error bars represent the mean and standard errors. (E) Cumulative effects of Cvi-0 QTLs. The percentage of plump seeds of all the 80 RILs is shown, but sorted according to the total number of Cvi-0 alleles in the six QTLs. The red horizontal lines represent the mean and standard errors. See also Table 1.
