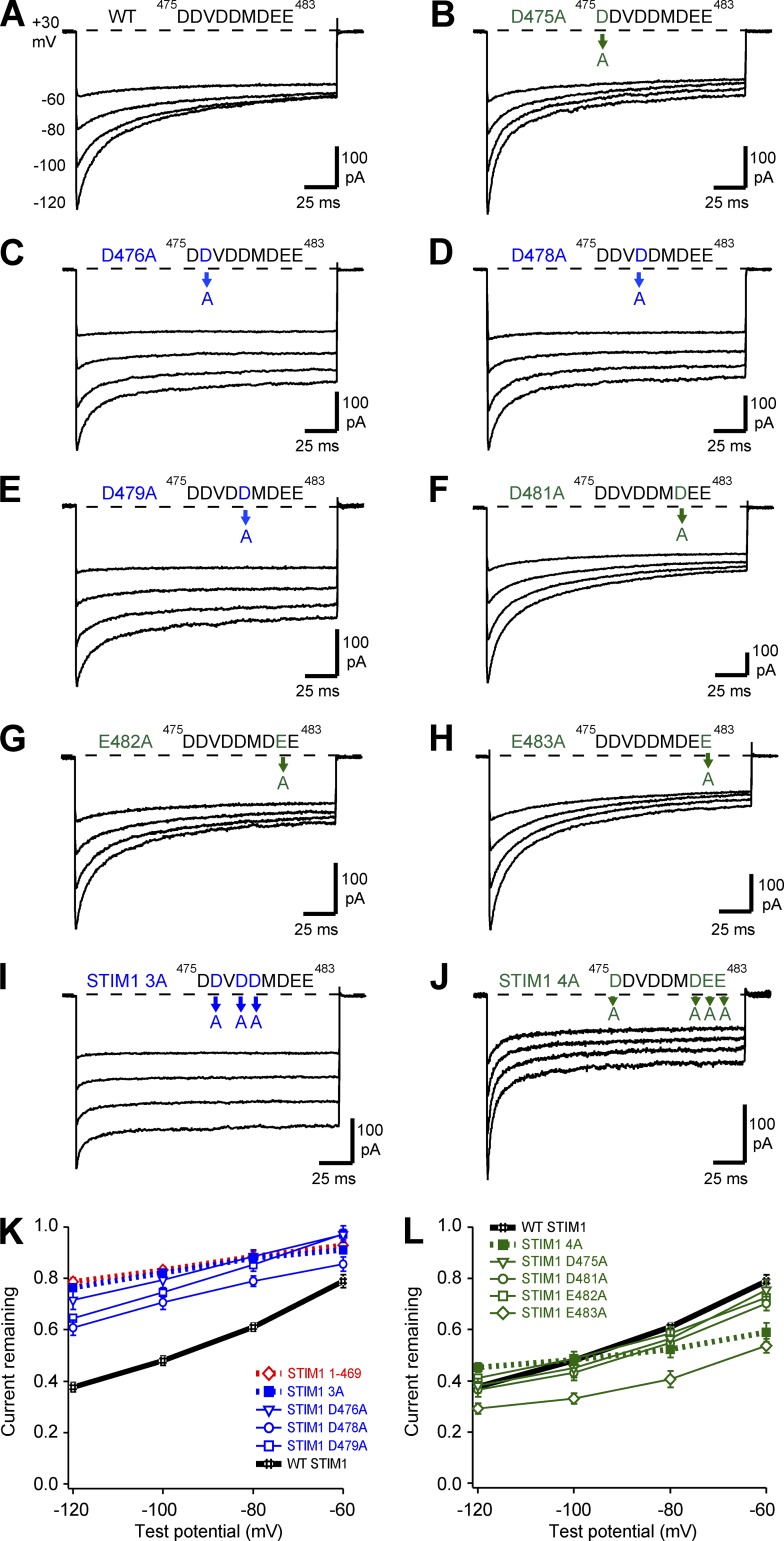
Figure 2.
Alanine scan of IDSTIM reveals two functional groups of acidic residues. All currents were recorded as described in Fig. 1 in cells cotransfected with WT Orai1-GFP together with either WT or mutant Ch-STIM1, with 20 mM Ca2+o and the standard 10 mM EGTA internal solution. Representative currents are shown for WT STIM1 (A, data from Fig. 1 A), D475A (B), D476A (C), D478A (D), D479A (E), D481A (F), E482A (G), and E483A (H). Representative currents for the STIM1 3A triple mutant (I; D476A D478A D479A) and the STIM1 4A quadruple mutant (J; D475A D481A E482A E483A) are also shown. (K) One group of neutralizations, highlighted in blue, strongly reduced the extent of CDI. Summary data for STIM11–469 are shown in red for comparison. (L) A second group of neutralizations, plotted in green, retained strong CDI. Each point on the summary graphs represents the mean ± SEM for n = 5–6 cells.

