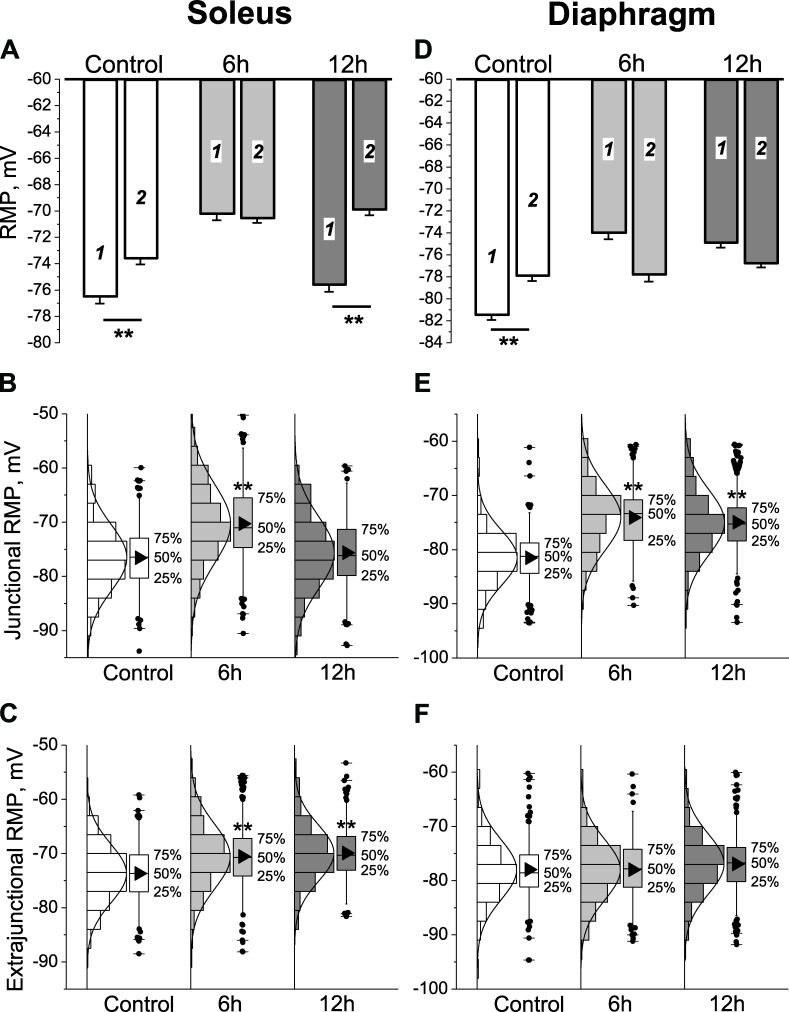
Figure 1.
HS alters the RMP of rat soleus and diaphragm muscles. (A and D) Mean RMP of junctional (1) and extrajunctional (2) membrane regions of soleus and diaphragm fibers in control group and after 6 and 12 h of HS. **, P < 0.01, mean RMP differences between junctional and extrajunctional membrane regions. In A: control (10 muscles), 191 fibers (junctional) and 211 fibers (extrajunctional); 6 h HS (14 muscles), 288 fibers (junctional) and 303 fibers (extrajunctional); 12 h HS (10 muscles), 176 fibers (junctional) and 165 fibers (extrajunctional). In D: control (6 muscles), 154 fibers (junctional) and 184 fibers (extrajunctional); 6 h HS (5 muscles), 144 fibers (junctional) and 158 fibers (extrajunctional); 12 h HS (8 muscles), 261 fibers (junctional) and 260 fibers (extrajunctional). (B, C, E, and F) Mean RMP values were obtained from a Gaussian fit to the distribution of RMPs (solid curves) for soleus (B and C) and diaphragm (E and F) muscles in the junctional (B and E) and extrajunctional (C and F) membrane regions. Box and whisker plots are shown for each distribution, indicating median, percentiles, outliers, and mean (black triangles). **, P < 0.01, differences in mean RMPs compared with corresponding control. Error bars indicate SEM.

