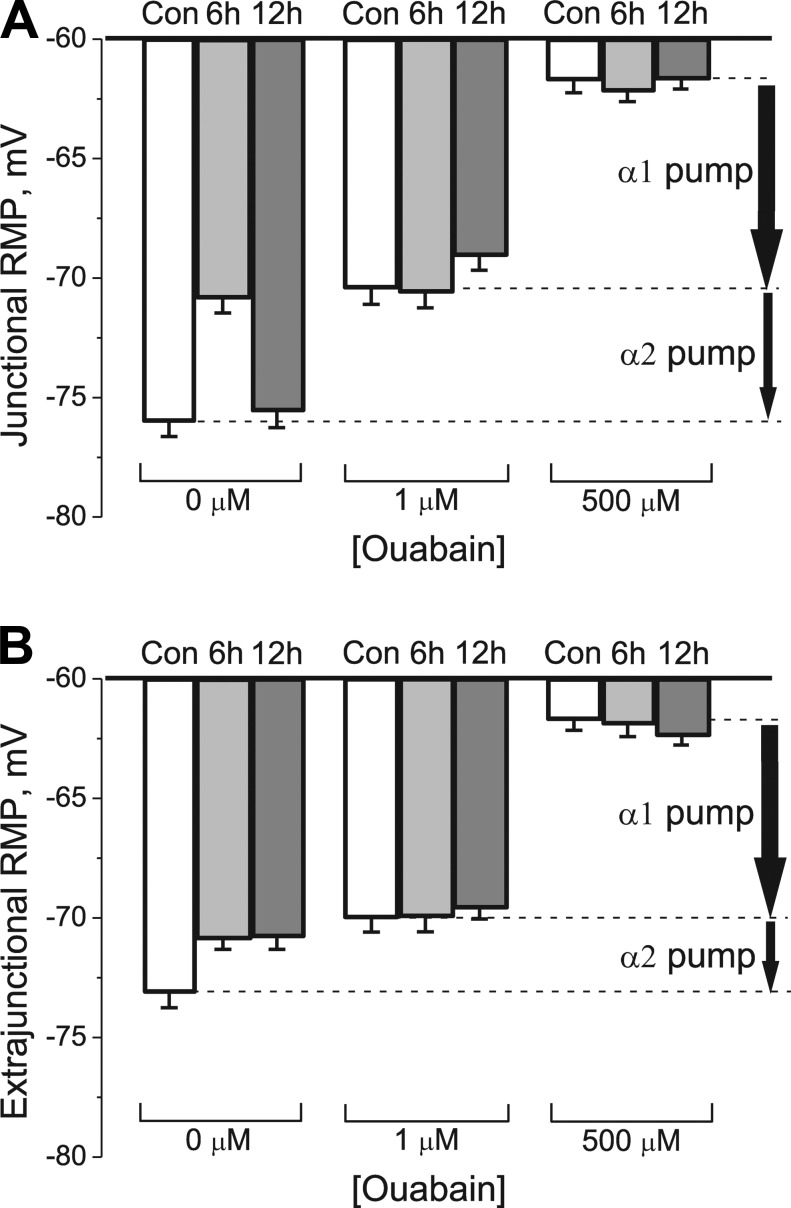
Figure 2.
Measurement of Na,K-ATPase electrogenic activity contributed by each α isozyme in control muscles and after HS. (A and B) Changes in mean RMP induced by ouabain in rat soleus muscle fibers in control (Con) and after 6 and 12 h of HS in junctional (A) and extrajunctional (B) membrane regions. RMPs were recorded before (zero ouabain concentration) and after 30-min incubation in 1 µM ouabain and after 30-min incubation with 500 µM ouabain. Vertical arrows indicate electrogenic contributions generated by α2 and α1 Na,K-ATPase isozymes in control muscles. The RMP reported at each data point represents the mean of measurements from a total of 98–140 fibers obtained from six muscles for each group of rats. Error bars indicate SEM.

