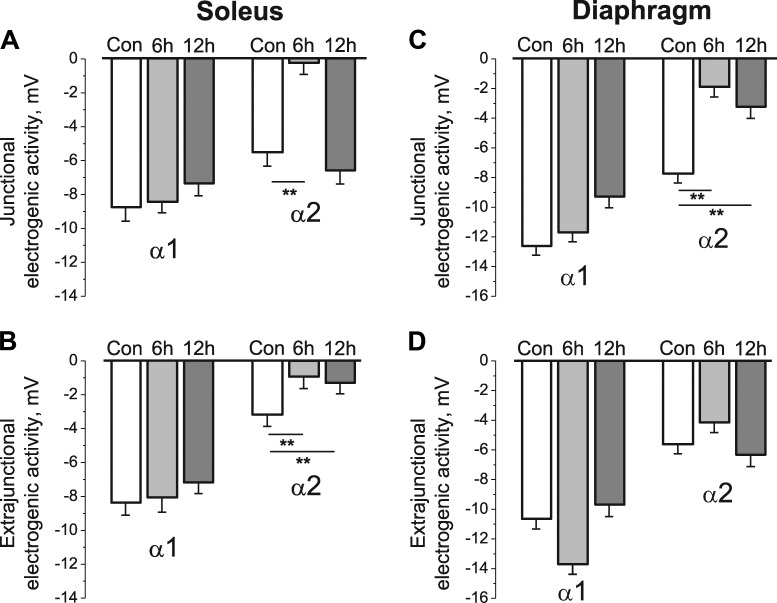
Figure 3.
HS specifically alters the electrogenic transport activity of the α2 Na,K-ATPase isozyme. (A–D) Na,K-ATPase α1 and α2 electrogenic activity measured in the junctional (A and C) and extrajunctional (B and D) membrane regions of rat soleus (A and B) and diaphragm (C and D) muscle fibers in control group (Con) and after 6 and 12 h of HS. (A and B) Six muscles for each group of rats (same muscles as in Fig. 2). (C and D) Six muscles (control), five muscles (6 h of HS), and four muscles (12 h of HS). Each value of electrogenic activity represents the mean of measurements from a total of 98–140 fibers (A and B) and 91–163 fibers (C and D). **, P < 0.01 compared with the corresponding control. Error bars indicate SEM.

