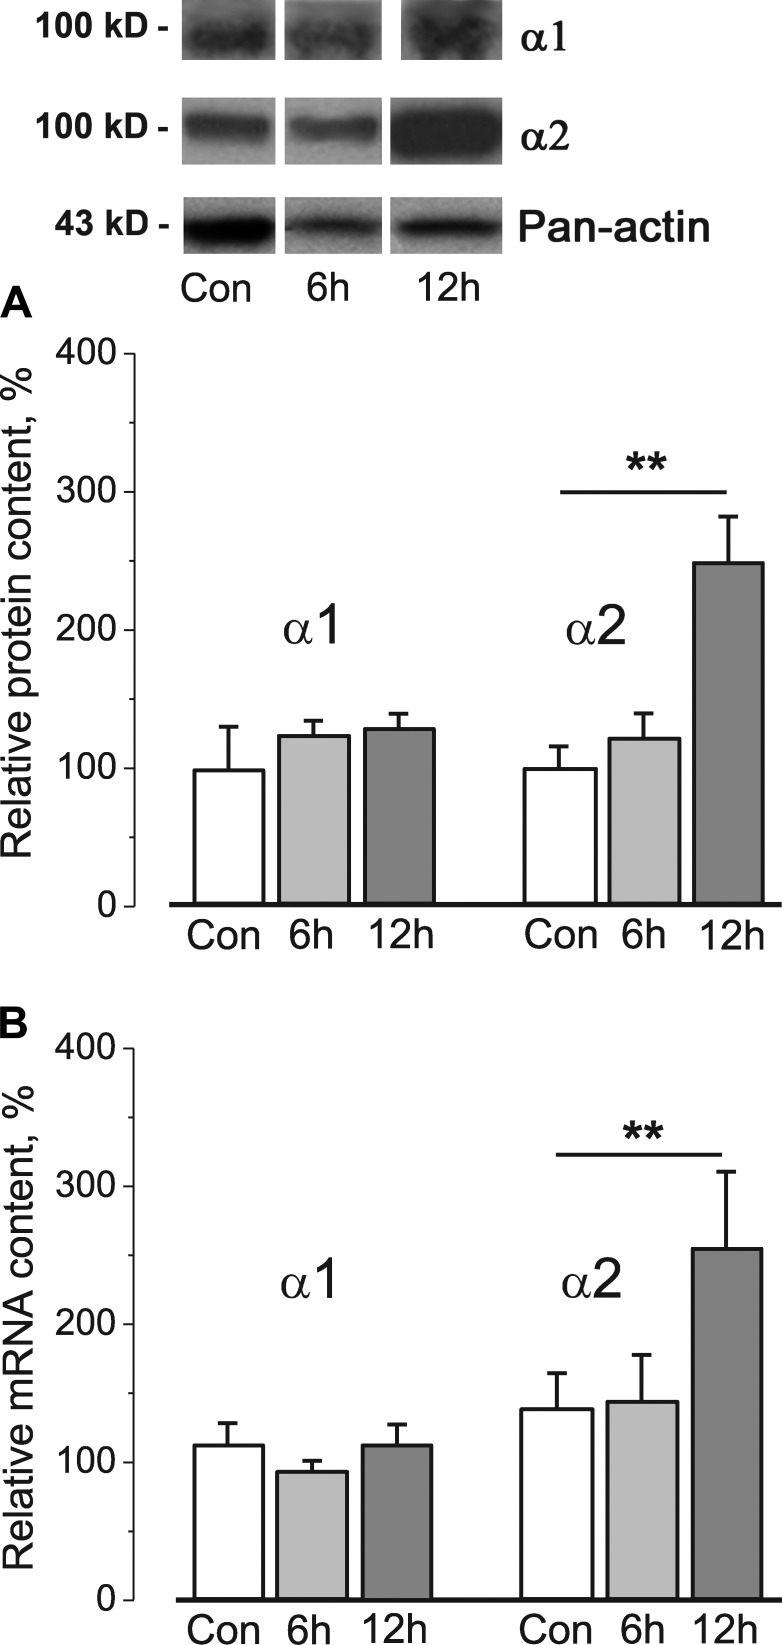
Figure 5.
12 h of HS specifically alters α2 Na,K-ATPase protein and mRNA content. (A and B) Relative Na,K-ATPase α1 and α2 protein (A) and mRNA content (B) in whole homogenates from the rat soleus muscles of control rats (Con) and after 6 and 12 h of HS. In A, the expression levels of α1 and α2 proteins were semiquantified by normalization of band intensities to the band intensity of pan-actin made from the same lysate. Top panels show representative immunoblots. In A and B, data were normalized to the mean level of expression under control conditions. Columns show mean data from 8–10 (A) and 5–16 (B) different muscle samples. **, P < 0.01 compared with control. Error bars indicate SEM.

