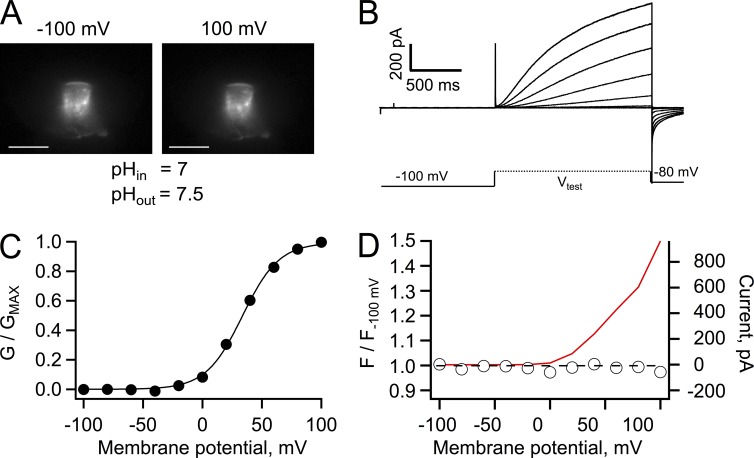
Figure 3.
Patch-clamp fluorometry of Venus-Hv1 at pHi 7. (A) Fluorescence images of an inside-out patch held at the indicated membrane potential. Bars, 10 µm. (B) Proton currents from the patch in A elicited by depolarizing voltage-clamp pulses, as indicated by the schematic protocol. (C) Conductance versus voltage curve derived from the currents in B. The continuous line is a fit to Eq. 2 with parameters qa = 1.62 eo and V0.5 = 33.6 mV. (D) Fluorescence measured from the whole patch area at each voltage was normalized to the fluorescence at −100 mV. A ratio equal to one at all voltages indicates the absence of dequenching of the fluorescence of Venus. The red continuous line is the I-V curve from the currents in B. The bath solution contained 10 mM HEPES buffer.

