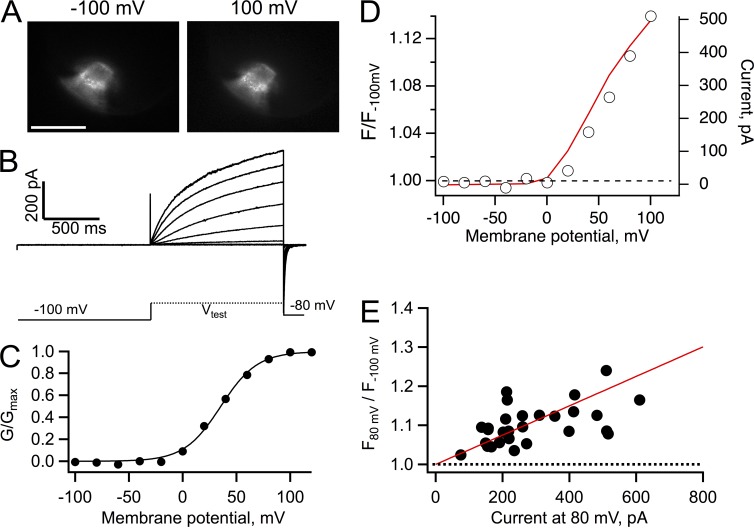
Figure 6.
Recovery of fluorescence dequenching in VenusH148G-Hv1 at pHi 7. (A) Fluorescence images of an inside-out patch from an oocyte expressing the construct VenusH148G-Hv1 held at the indicated membrane potential. Bar, 10 µm. (B) Proton currents from the patch in A elicited by depolarizing voltage-clamp pulses. (C) Conductance versus voltage curve derived from the currents in B. The continuous line is a fit to Eq. 2 with parameters qa = 1.47 eo and V0.5 = 35.4 mV. (D) Fluorescence dequenching measured from the whole area of the patch in A. The red curve is the I-V curve for the same patch. (E) The fluorescence from 28 patches similar to A was measured at 80 mV, normalized to the fluorescence at −100 mV, and plotted as a function of the current magnitude at 80 mV, as in Fig. 4. A ratio greater than one at all voltages indicates dequenching of the fluorescence of VenusH148G. The bath solution contained 10 mM HEPES buffer. The continuous red line is the predicted dequenching by Eq. 4 with parameters rp = 10 µm, ro = 5 µm, lp = 15 µm, Ka = 2.81 × 10⁻⁸, αo = 0.26, fpKa = 7.6, DBH = 5 × 10⁻¹⁰ m2/s, and Btotal = 10 mM.

