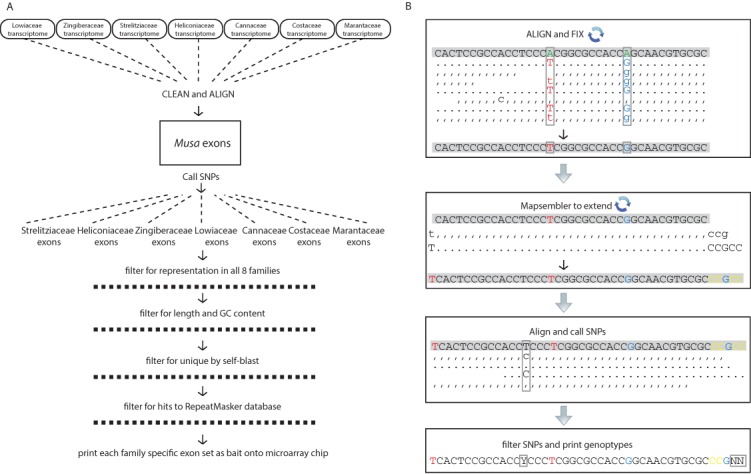
Figure 1. Schematic diagrams for the bioinformatic work flow.

(A) Work flow to generate family specific bait sequence from transcriptomes and the annotated exons from Musa acuminata and (B) work flow to generate individual sequences for each gene from raw reads independent of de novo assembly. Base changes and SNPs are highlighted and the schematic is represented as in the SAMtools tview format (i.e., reverse reads are represented with commas and lowercase letters). The representation is condensed to show examples of how the reads are transformed but the actual coverage used to call SNPs was at least 20× (see methods).
