Figure 3.

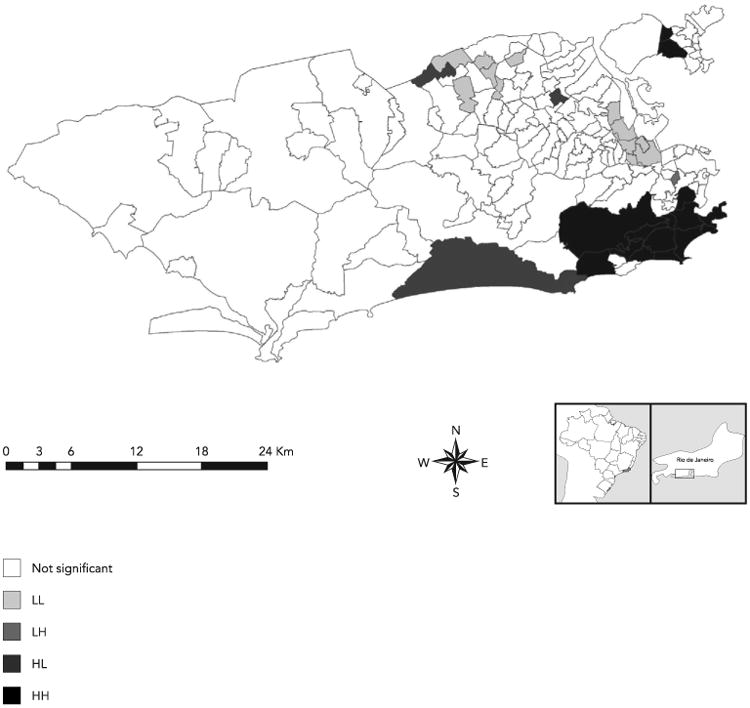
Map displaying the local autocorrelation (Local Moran Index) for the ward-level Urban Health Index (UHI) values, Rio de Janeiro, Brazil, 2010, with statistically significant clusters of high index wards (HH) and low index wards (LL).

Map displaying the local autocorrelation (Local Moran Index) for the ward-level Urban Health Index (UHI) values, Rio de Janeiro, Brazil, 2010, with statistically significant clusters of high index wards (HH) and low index wards (LL).