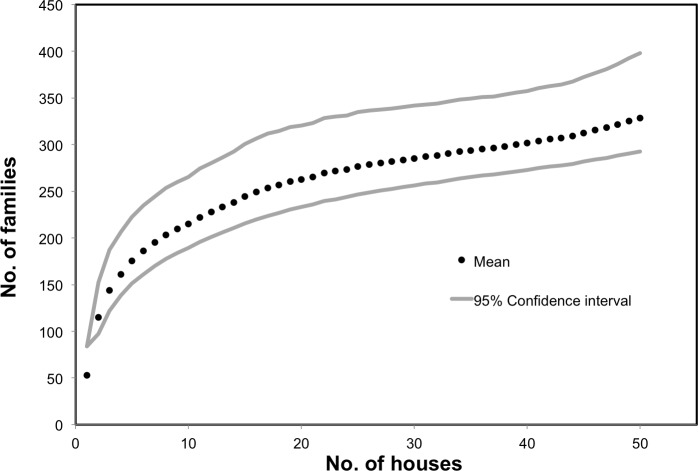
Figure 2. Estimated diversity of families.
The mean, along with 95% lower and upper confidence intervals, was calculated based on the complete list of families acquired over each sampled house using the Chao2 Estimator with 1,000 randomization runs in EstimateS (Colwell, 2013).

