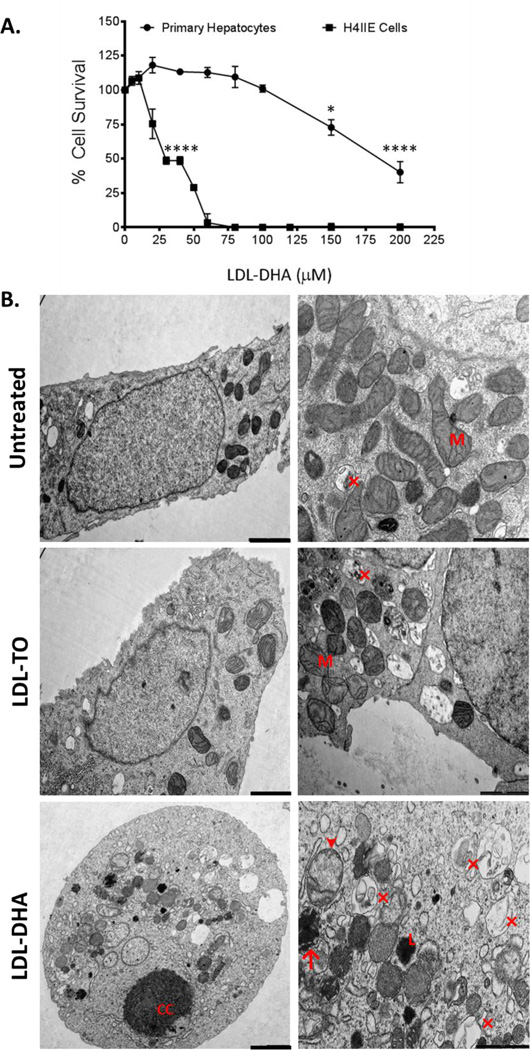
Figure 1. Effects of LDL nanoparticles on primary hepatocytes and H4IIE cells.
(A) MTS dose response assay of ACI rat primary hepatocytes and H4IIE cells to LDL–DHA (0–200 µM). Experiments were performed in triplicate wells with at least three independent runs. Results are expressed as mean ± SEM. *, P ≤ 0.05; ****, P ≤ 0.0001 versus corresponding untreated group. All readings after 25 µM are significant at P ≤ 0.0001 for the H4IIE cells. (B) Transmission electron microscopy of H4IIE cells at baseline (untreated) and those treated with LDL-TO and LDL–DHA for 24 hours. Left panel (2000 nm magnification bar) right panel (1000 nm magnification bar). CC, nuclear chromatin condensation; M, mitochondria; Arrow head denotes swollen dysmorphic mitochondria; arrow condensed mitochondria; (×) autophagosome/autolysosome; L, lysosome.

