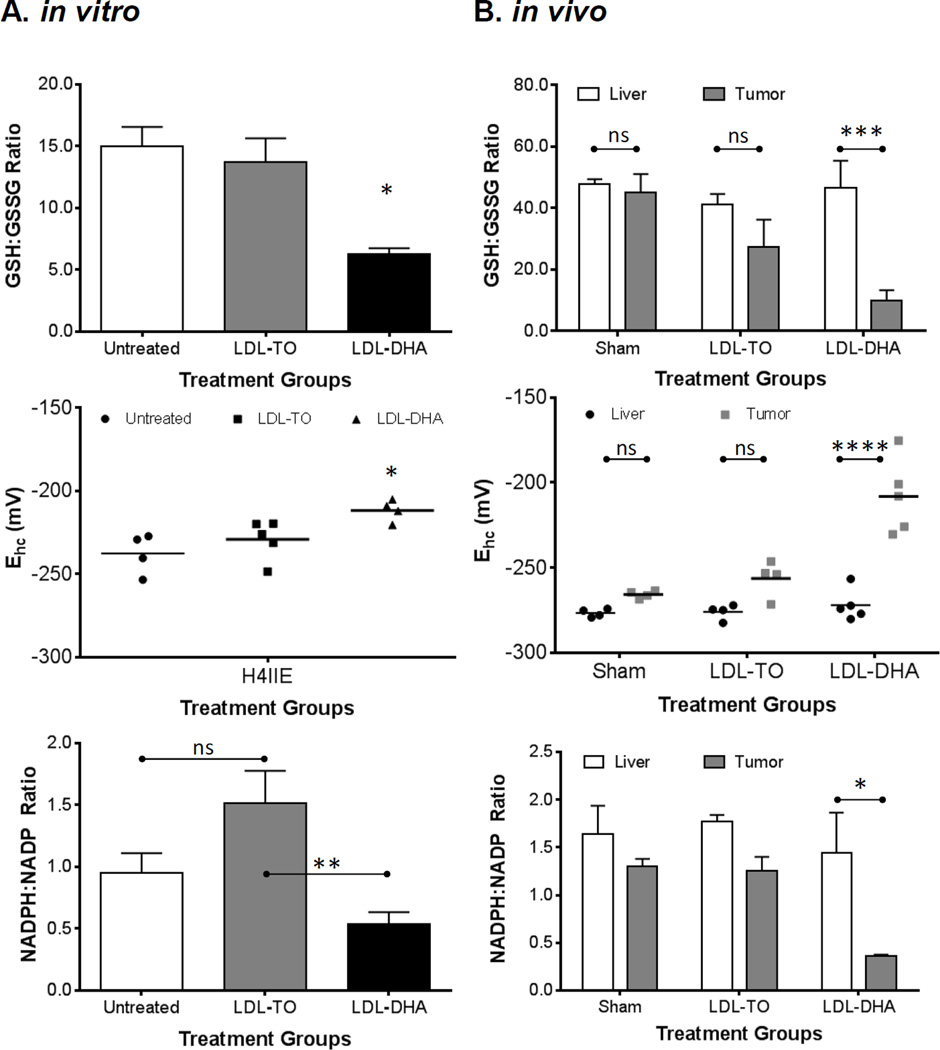
Figure 7. In vitro and in vivo redox couples following LDL nanoparticle treatments.
(A) GSH/GSSG, glutathione half-cell potential, and NADPH/NADP levels in H4IIE cells at baseline (untreated) and 48 hours after LDL nanoparticle (40 µM) treatments. (B) GSH/GSSG, glutathione half-cell potential, and NADPH/NADP levels in rat liver and H4IIE tumor 72 hours after Sham and HAI treatment of LDL nanoparticles (2 mg/kg). The data are expressed as mean ± SEM for each treatment group (B). *, P ≤ 0.05; **, P ≤ 0.01; ***, P ≤ 0.001; ****, P ≤ 0.0001 versus indicated groups.

