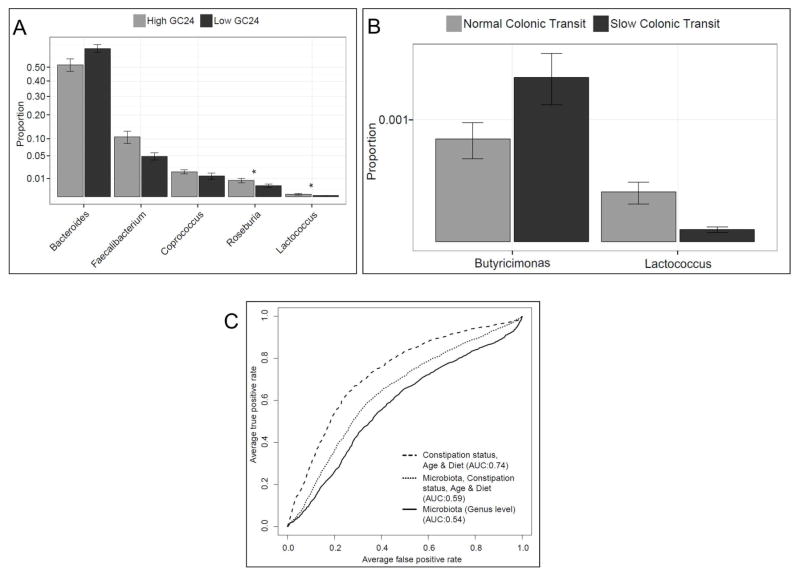
Figure 1. Relationship between stool microbiota and colonic transit.
The analysis shows microbiota evaluated with the RF algorithm that was associated with colonic transit expressed as continuous (A) or dichotomous variables (B). In A, the bar graph represents the relative abundance of all genera in participants with GC24 less than (Low GC24) and ≥ (High GC24) the median value (1.8) in all participants. The asterisk represents genera that were also significant by single taxon analysis. In B, colonic transit is categorized as normal (GC24 ≥1.4 [10th percentile value in healthy women]) and slow (GC24 <1.4) colonic transit. (C) ROC curves showing the utility of i) stool microbiota at the genus level; ii) constipation status, age, and diet; and iii) both i) and ii) for discriminating between normal and slow colonic transit.

