
Figure 3. Increasing of B220+ B cells in rapamycin (Rapa) treated allografts on day 28 post transplantation.
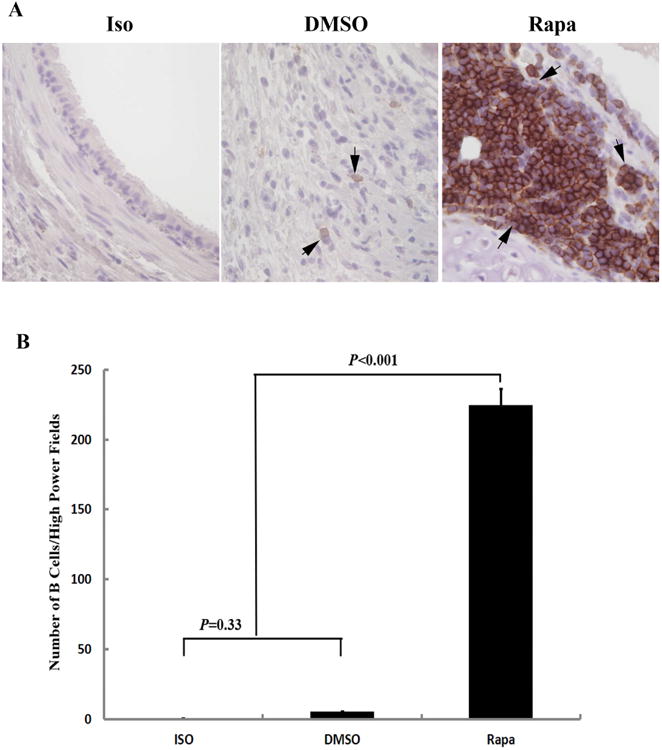
A Representative pictures of B220 staining in the allografts and isograft (Iso) controls from 28 days post-transplantation. Brown color/Solid arrows indicate B220+ cells. The magnification is 400×. B Comparison of B220+ B cell infiltration in the Rapa treated allograft with the isograft (Iso) and DMSO control allografts on day 28 post transplantation. Data shown are the mean ± SD *, n=6.