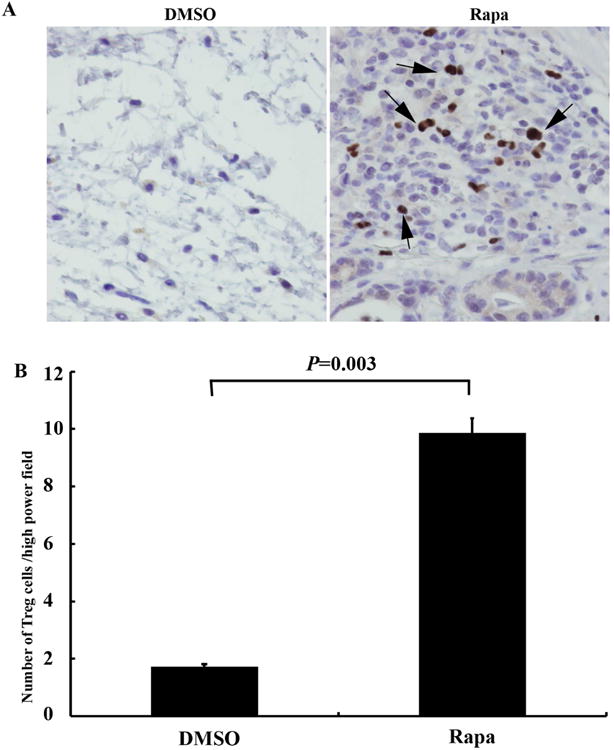
Figure 7. Comparison of Effects of Rapa on FoxP3+ regulatory T cells (Tregs) in the allografts with DMSO controls on day 28.

A Representative immunohistochemical staining of FoxP3+ Tregs in the treated allografts. Cells stained brown indicate positive staining cells (marked by arrows). The magnifications are 400×. B Statistical analysis of Tregs cells in Rapa treated and DMSO control in the allografts. The number of positive staining cells per high power field (400×) was assessed by Photoshop counting tool, and at least 5 fields were counted per trachea. Data shown are the mean ± SD, n=6.
