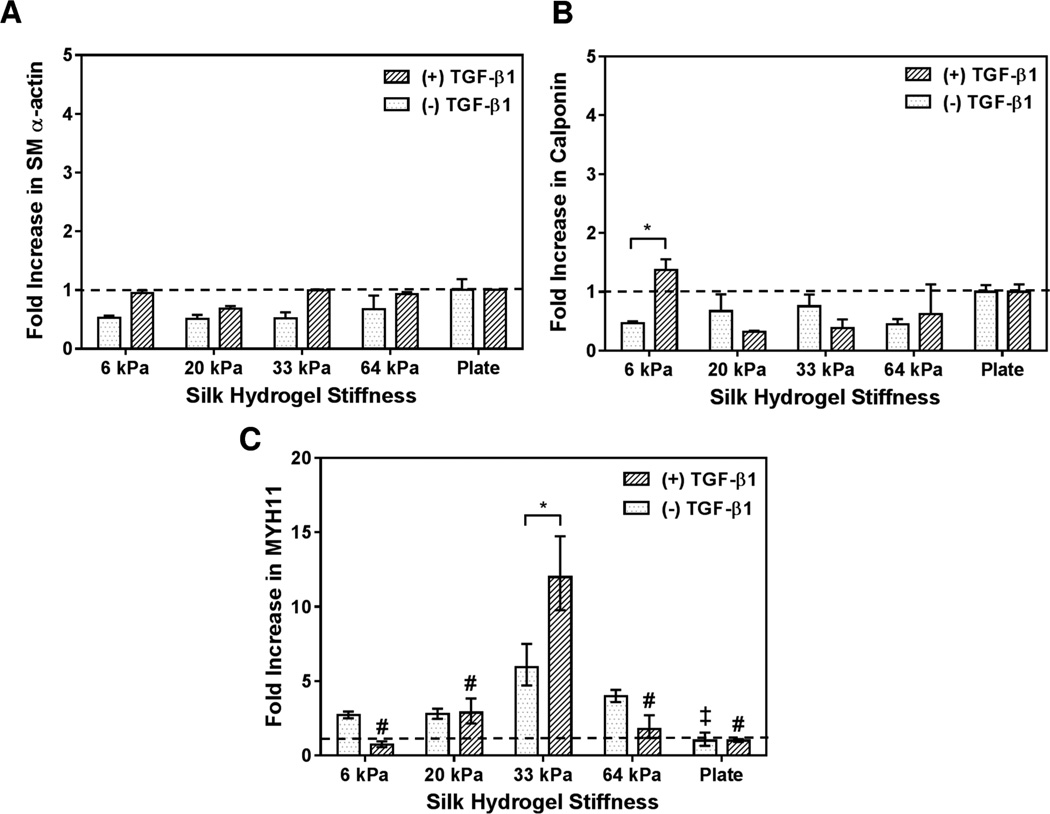
Figure 6. PCR data.
PCR assessment of selected vascular markers of hMSCs cultured on silk hydrogels of different stiffness for 72 h: (a) smooth muscle α-actin, (B) calponin, and (C) MYH11. * indicates significant difference between groups (p < 0.05). ‡ indicates significant (p < 0.05) difference from the gene expression for hMSCs cultured without TGF-β1 on SF hydrogels compared to 33 kPa (SF3) condition. # indicates significant (p < 0.001) difference in gene expression for hMSCs cultured with TGF-β1 on SF hydrogels compared to 33 kPa (SF3) condition.

