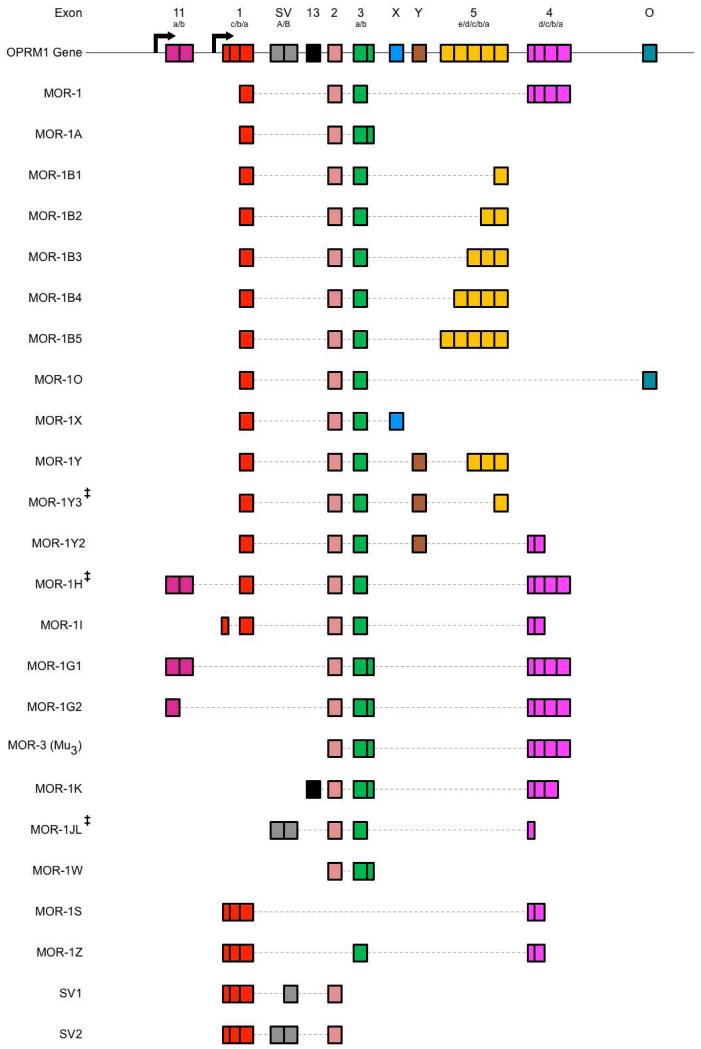
Figure 1. Schematic Representation of Human OPRM1 Alternative Splicing.
The human OPRM1 gene is composed of numerous exonic and intronic regions that are selectively utilized through alternative splicing mechanisms in order to generate various MOR isoforms. Unfortunately, exon names and definition sequences are not well conserved within the literature, leading to disparities between isoform compositions. Furthermore, additional MOR isoforms have been predicted, but have not yet been verified in vitro or in vivo. As such, splicing patterns of select MOR isoforms are illustrated here according to a comparative analysis of exon and intron inclusions across multiple literature sources. Top schematic represents positions of known exonic regions within the human OPRM1 gene, with arrows indicating transcription initiation sites. Accepted names for exonic regions are annotated above each region, with sub-annotations indicating variable exon cassettes due to multiple 3’ and 5’ splice sites. Splicing patterns of known opioid receptor isoforms are schematized and aligned below OPRM1 gene, with accepted isoform names displayed to the left, incorporated exon cassettes represented by solid boxes, and excised regions represented by a thin, dotted line (Reference Sequences: NM_000914.4, NM_001008504.3, NM_001145282.2, NM_001145283.2, NM_001145284.3, NM_001145285.2, NM_001145286.2, NM_001008503.2, NM_001008505.2, NR_104351.1, NR_104349.1, AY364230.1, DQ680044.1, NM_001145279.3, NM_001145280.3, NM_001145281.2, NM_001285528.1, NM_001145287.2, GQ258059.1, NM_001285527.1, NM_001285522.1, NR_104350.1; ‡ = predicted isoform) (Andersen et al., 2013; Choi et al., 2006; Fricchione et al., 2008; Pasternak and Pan, 2013; Xu et al., 2013; Xu et al., 2009).

