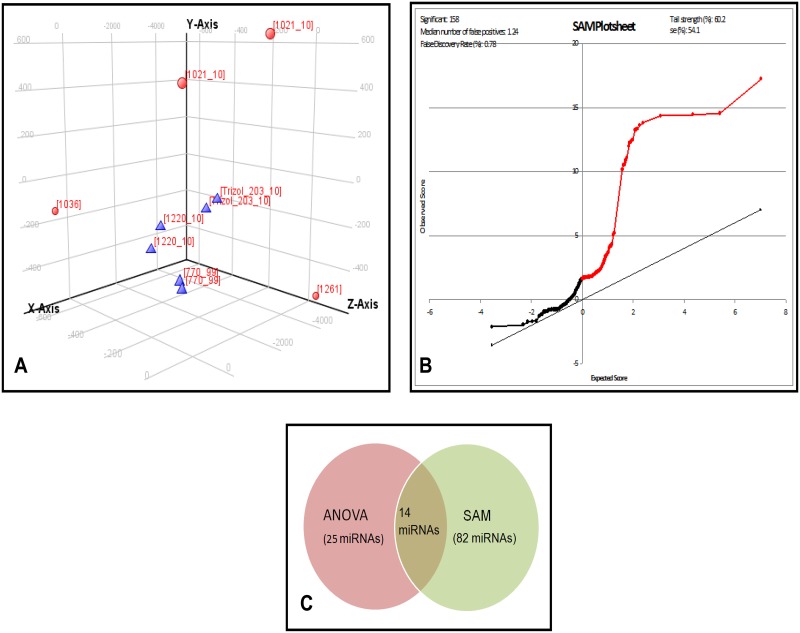
Fig 1. Unsupervised and supervised analysis of miRNA expression in UM.
A: Graphical representation of the unsupervised analysis: principal component analysis (PCA) for the UM tumor tissues: M3 (n = 3), and D3 (n = 3) showing the clustering of samples correspondingly in to two distinct groups (M3 and D3). Blue colored triangle denotes M3 UM tumors while red colored spheres denotes D3 UM tumors. B: Supervised analysis: The significance analysis of microarray (SAM) plot reveals the de regulated miRNAs between the monosomy and disomy formalin fixed UM primary tumors. The false discovery rate (FDR) has set at Q = 0.78%. The list of miRNAs with Q = 0.0 has been considered for the validation by qRT-PCR. C: Venn diagram on intersection of miRNAs obtained from ANOVA and SAM. miR-134, miR-1238, miR-149* are the common select miRNAs observed from this study.

