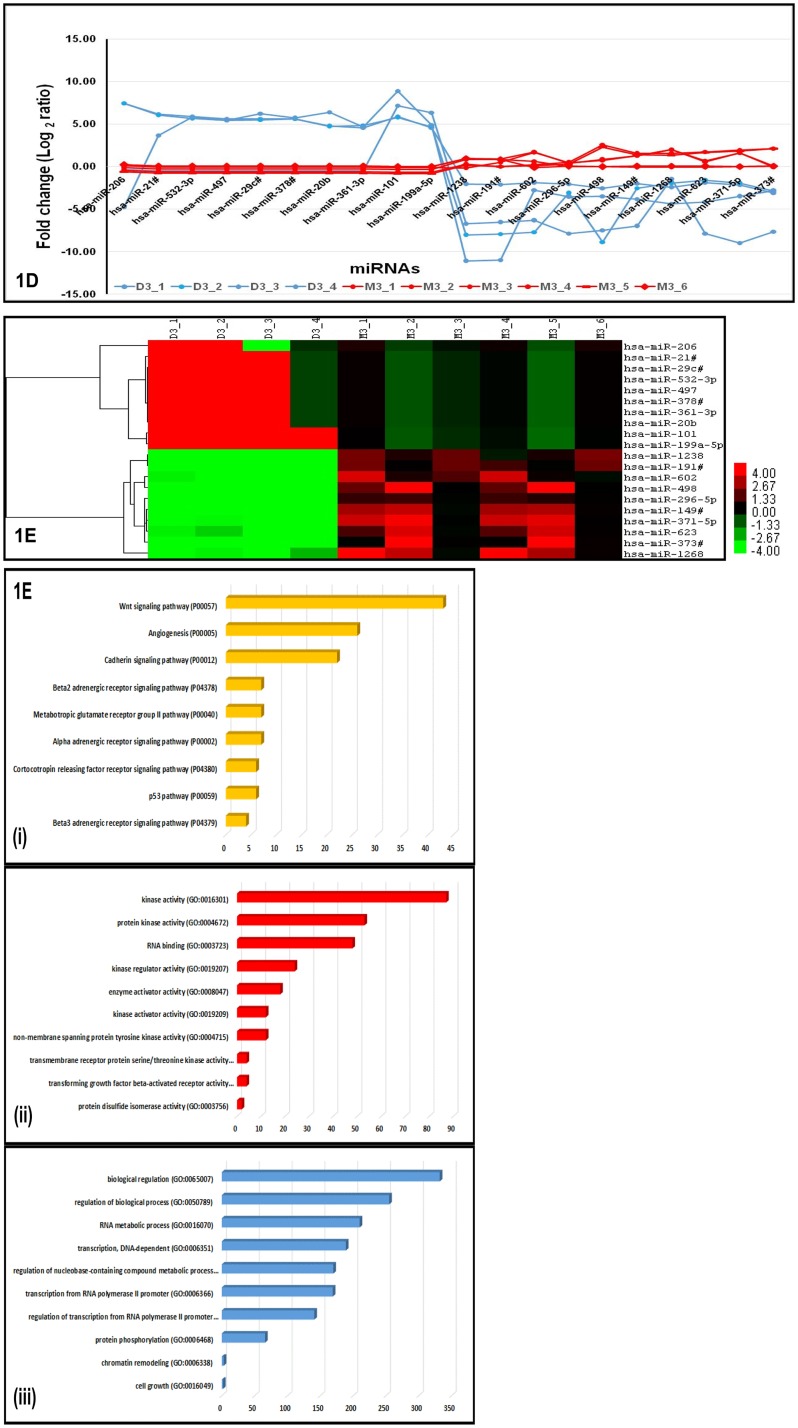
Fig 2. Significantly dys-regulated miRNAs and pathways in UM.
A: Trendline graph shows the absolute expression of key miRNAs identified by ANOVA and SAM. The differentially expressed miRNAs indicates the discriminating profiles in M3 and D3 UM tumors. The blue line indicates the miRNA expression in D3 UM tumors while red line indicates the miRNA expression in M3 tumors. B: Hierarchical cluster shows key miRNAs subjected to unsupervised analysis. The differentially expressed miRNAs indicates the co-expression pattern across M3 and D3 UM tumors. The green colour indicates the down-regulated miRNAs while the red colour indicates the up-regulated miRNAs in M3 and D3 UM tumors. C: Analysis of key gene ontology (GO) and Pathway Enrichment by the differentially expressed miRNAs. A few of the pathways (i) and GO (ii and iii) targeted by these differentially expressed miRNAs using miRTarbase and PANTHER data base with p-value cut-off ≤0.05 along with Boneferroni FDR correction.

