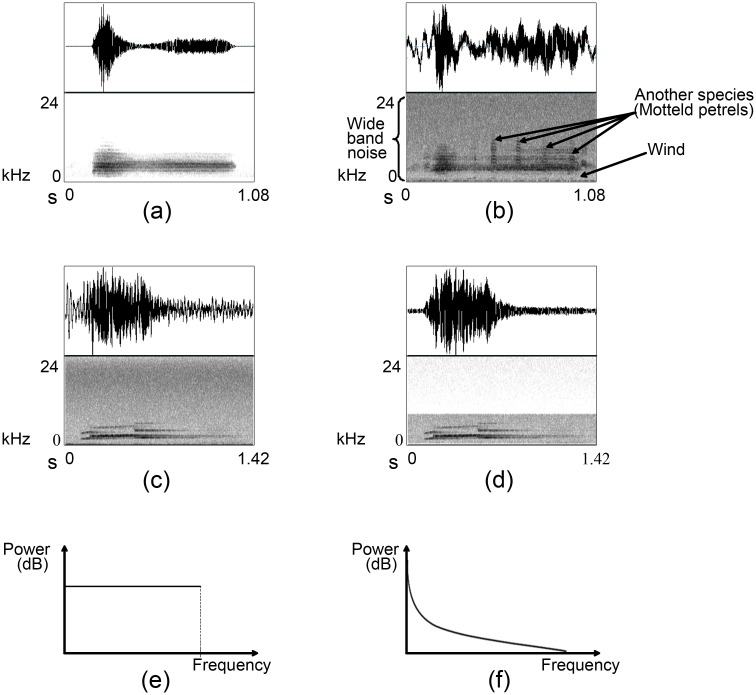
Fig 3. Examples of bird calls with various degrees of noise, the effect of band-pass filtering and power spectrum of white and pink noise.
The top row of each sound figure displays the oscillogram and the second row the spectrogram. (a) A less noisy example of kakapo chinging with limited noise and (b) a noisy example of kakapo chinging. (c) An original male kiwi whistle and (d) its noise filtered (band-pass) signal. Noise is visible as a grey background in the spectrogram surrounding the sound depiction and most of the high-frequency variation in the oscillogram. Power spectrum of (e) white noise and (f) pink noise.

