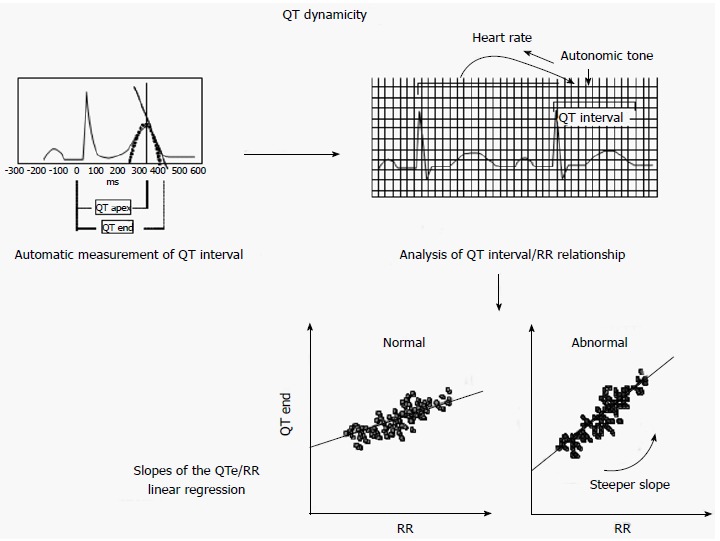
Figure 2.

QT dynamicity analysis is based on automatic measurement of QT interval (QT apex and QT end) during 24 h electrocardiogram monitoring. The relationship between these measures and the corresponding RR intervals allows a slope of regression analysis to be obtained. A steeper slope reflects a wider QT variability suggesting abnormalities in ventricular repolarization.
