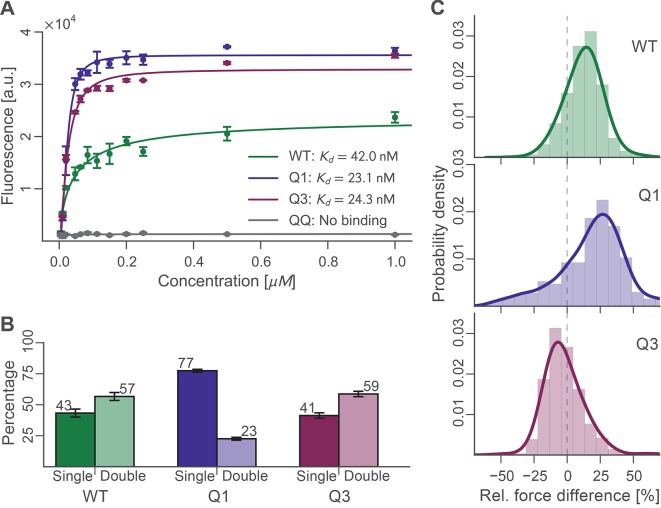
Figure 4. Bulk and single-molecule characterization of Doc mutants.
(A) Fluorescence binding curve showing binding of TagRFP-labelled Coh to wild-type and mutant Doc nonspecifically immobilized in a 96-well plate. Both Q1 and Q3 mutants bound TagRFP-Coh similarly to wild-type with dissociation constants (KD) in the low nM range. The negative control QQ mutant showed no binding. Solid lines are 4 parameter logistic nonlinear regression model fits to the data. Error bars represent the standard deviation of three independent samples. (B) Event probabilities for single (opaque colors) and double (translucent colors) Coh:Doc rupture peaks determined for Doc wild-type and DE/AA quadruple mutants. Data originate from 947, 4959, and 1998 force-extension traces from wild-type, Q1 and Q3 variants, respectively. Error bars represent 95% Clopper-Pearson confidence intervals based on the beta probability distribution. (C) Relative difference in double peak rupture forces for the different Doc variants. Positive values indicate a stronger final peak. Histograms represent concatenated data from various pulling speeds. Drawn lines are kernel density estimates calculated on the raw data.
DOI: http://dx.doi.org/10.7554/eLife.10319.007

