
Figure 3. Cα difference distance matrix plot reveals movements that occur concurrent with substrate binding for E. coli class Ia RNR.
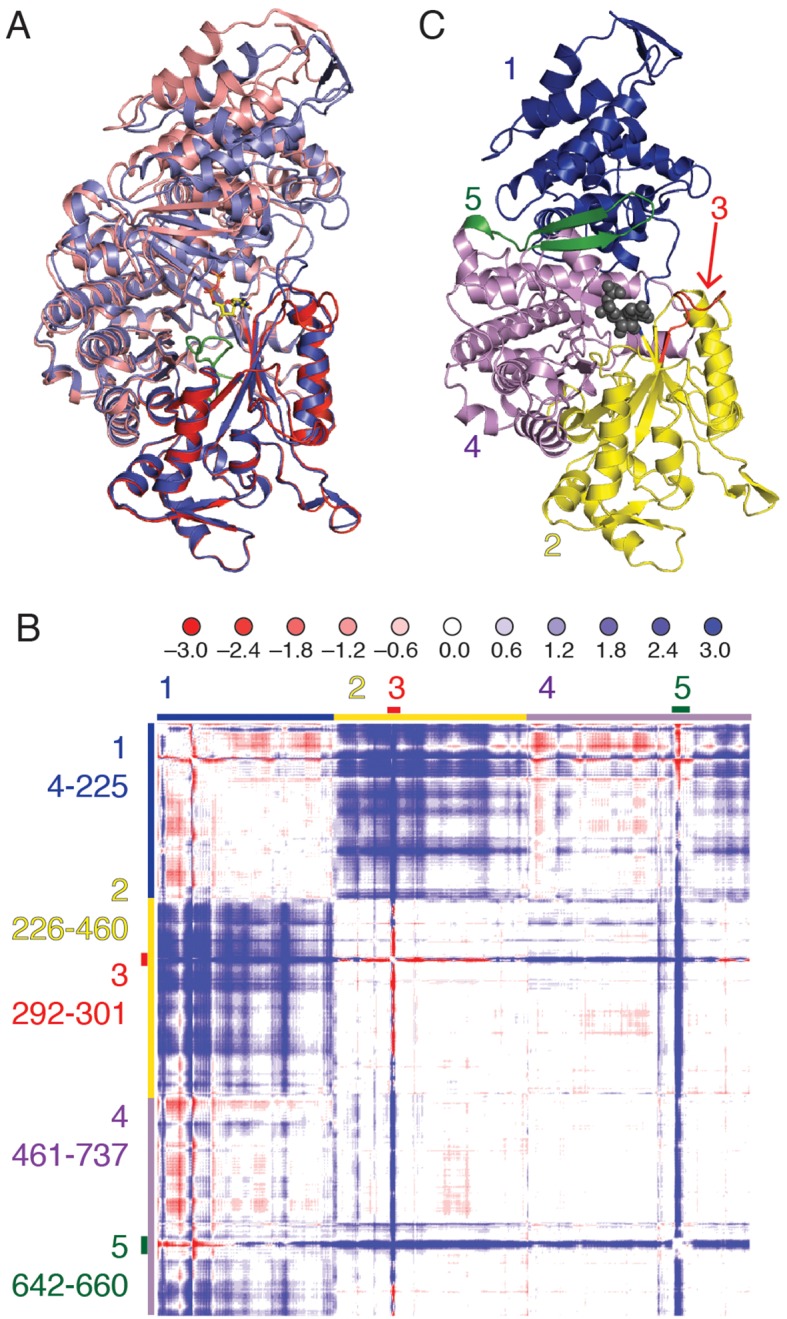
(A) Superposition of α from our CDP/dATP structure (N-terminus and one half of the active site barrel in purple and the other half barrel in blue) and α from a substrate-free E. coli RNR structure (PDB ID: 3R1R, (Eriksson et al., 1997)) (N-terminus and one half of active site barrel in pink and the other half barrel in red). The two chains were aligned by the active site finger loop, which is colored green. CDP is shown as sticks. (B) Distances in chain A of the CDP/dATP structure (this work) were subtracted from chain A of the substrate-free α2 structure (PDB ID: 3R1R) for residues 4–737. Scale is shown on the top and is ±3.0 Å (positive values in blue indicate a shorter distance in the CDP/dATP structure and negative values in red indicate a longer distance). Regions that move in a concerted fashion are indicated with colored lines and residue ranges are listed to the left of the plot. (C) One α chain is shown in ribbons with residue ranges from (B) colored. Region 1 (blue), the N-terminal 225 residues, contracts towards region 2 (yellow). Region 3 (red) includes loop 2 residues and moves towards the active site (in region 4). A flexible loop, region 5 (green), undergoes a large motion towards regions 2 and 4 whereas region 4 undergoes little movement with respect to the rest of the structure.