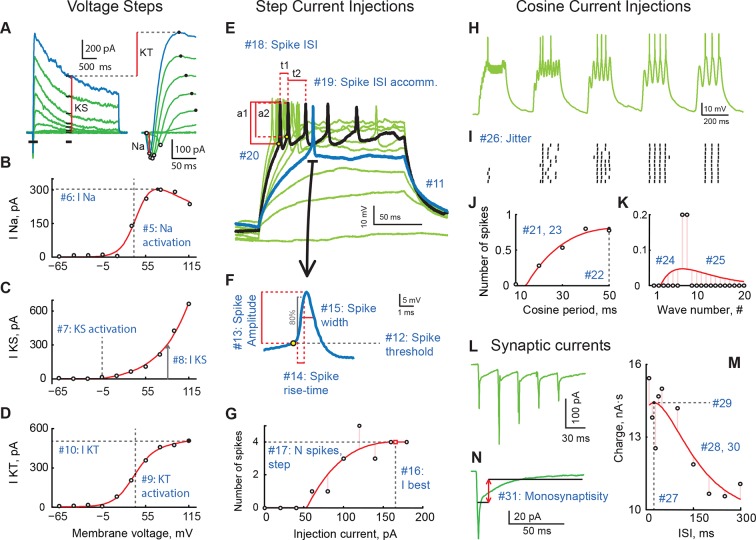
Figure 1. A review of cell properties characterized in this study (See methods for a detailed description of every measurement).
(A) Response to voltage clamp steps after passive current subtraction; full currents on the left, a zoom-in look at early active currents on the right. Red vertical lines show how voltage-gated sodium (INa), stable potassium (IKS), and transient potassium currents (IKT) were measured. (B) IV curve for INa. (C) IV curve for IKS. (D) IV curve for IKT. (E) Spiking responses to current step injections of different amplitudes; first response to produce a spike is shown in blue; response generating maximal number of spikes is shown in black. (F) An expanded look at the first spike produced by the cell in response to step current injections. (G) Number of spikes as a function of step current injection amplitude. (H) A trace of membrane potential recorded from the cell in response to cosine current injections of varying frequency. (I) Spike-raster of 10 consecutive responses to cosine injections shown in H. (J) Average number of spikes in response to a single cosine injection as a function of cosine period. (K) Average number of spikes per cosine wave in response to injections of shortest period (10 ms; leftmost group in panels H and I. (L) Sample trace of excitatory synaptic currents recorded in voltage clamp mode in response to optic chiasm stimulation with a 30 ms inter-stimulus interval. (M) Total postsynaptic charge as a function of inter-stimulus interval. (N) Average postsynaptic current showing time-windows that were used to build the "Monosynapticity ratio". Panels (A–D) originate from one cell; panels (E–M) were recorded in another cell; both from stage 49 animals.

