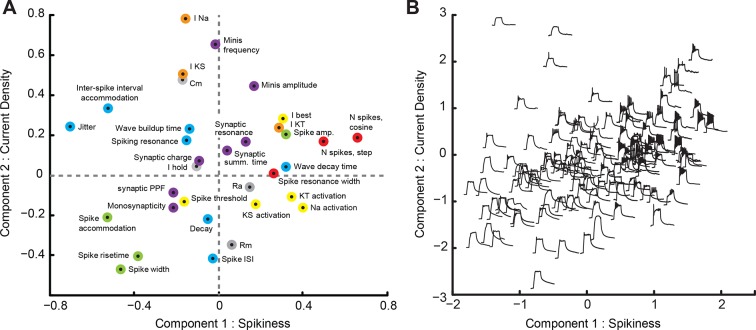
Figure 4. Principal Component Analysis (PCA).
(A) Loading-plot, presenting contribution of individual cell properties to the first two PCA components (see detailed description in the text). Points are colored with regards to how they describe the spikiness of the cell (red), shape of spikes (green), their temporal properties (blue), ionic currents (orange), passive electrical properties (gray), or synaptic properties of the cell (purple). (B) Modified score-plot showing how individual cells score on first two PCA components, with responses of respective cells to step current injections used instead of standard plot markers. Responses on the right are spikier that those on the left, while responses on the bottom have a greater passive component than responses on the top.

