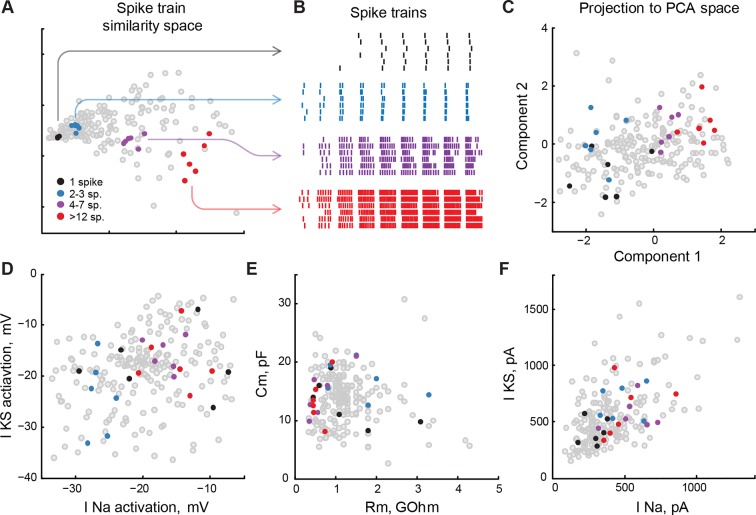
Figure 8. Low-level cell properties are a bad predictor for spiking output.
(A) Multidimensional scaling of differences between cell spiking outputs onto a 2D plane. Cells that produced similar trains of spikes in response to step current injections, both in terms of the total number of spikes, input-output curve, and spike latency, are located nearby. (B) Spike-raster for several subsets of 6 cells each shown in panel A. Spiking outputs of cells are very different between the groups, but are closely matched within each group. (C) Groups of cells from panels A and B, projected into PCA space that describes the full variability of cell properties. Clusters of cells are still visible, but they are no longer compact, and groups are partially overlapping. (D–F) The same groups of cells are shown on correlation plots for meaningful (both biologically and statistically; see text) pairs of cell properties: threshold potentials for voltage-gated sodium and stable potassium currents (D), membrane resistance and capacitance (E), and ionic currents amplitudes (F). The clusters are strongly overlapping, suggesting that cells in which a small subset of properties match can be tuned to produce strikingly different spiking outputs. Threshold data in panel D is renormalized to avoid overplotting (see 'Materials and methods').

