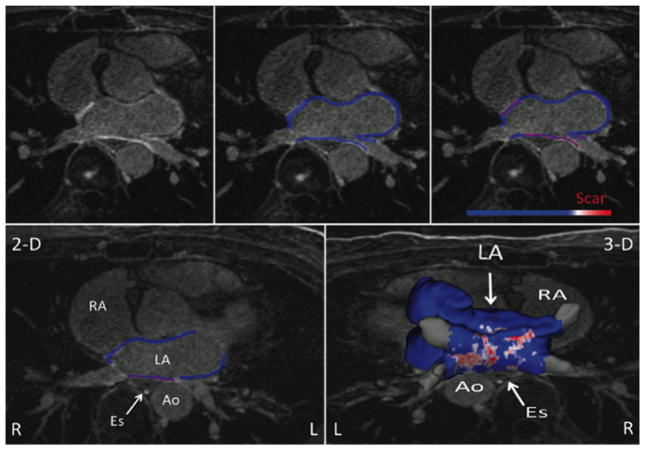
Fig. 3.
The left atrial wall segmentation on the LGE-MRI and serial steps taken to determine scar formation in the entire left atrium. Top row shows axial LA MR image (left), segmented LA wall (middle), and enhanced area marked as scar (right). Bottom row shows one segmented slice (left) and all the slices put together for the entire LA (right)

