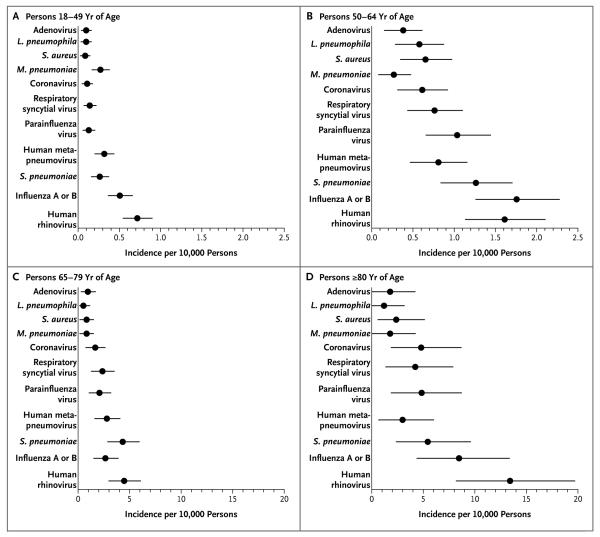
Figure 3. Estimated Annual Pathogen-Specific Incidence Rates of Community-Acquired Pneumonia Requiring Hospitalization, According to Age Group.
Circles indicate the annual number of hospitalizations for pneumonia per 10,000 adults, and the horizontal lines 95% confidence intervals. Rates are based on 10,511,911 person-years of observation. Note the differences in the scale of the x axis for the groups of patients 65 to 79 years of age and 80 years of age or older, as compared with the groups of patients 18 to 49 years of age and 50 to 64 years of age.

