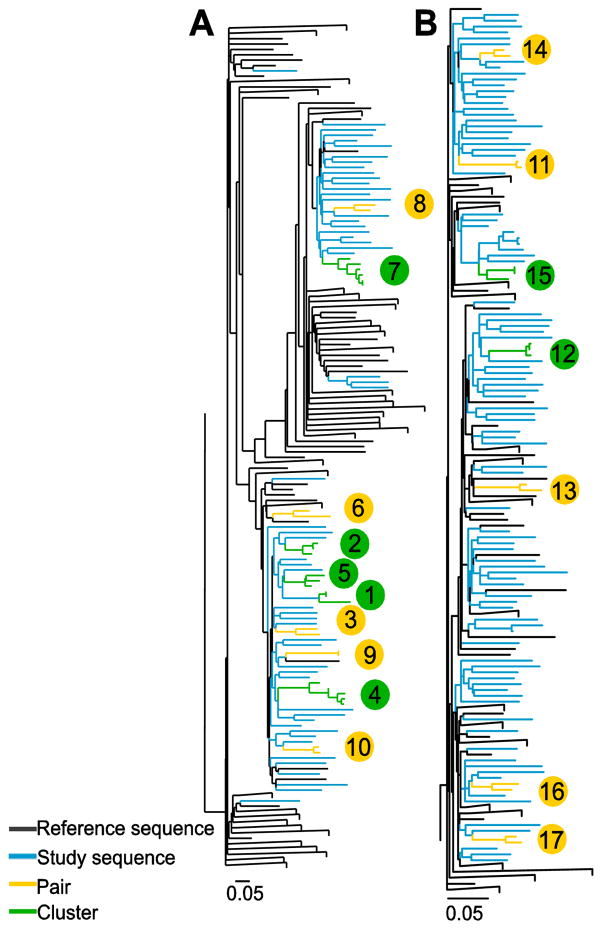
Figure 2.
Maximum-likelihood phylogenetic trees of a 1104 bp region encompassing the Core to E2 (minus HVR1) region were generated for HCV (A) genotype (G) 1a and (B) G3a from people with recently acquired HCV infections in Australia between 2004 and 2014. The tree for G1a contained 85 sequences from study participants and 635 reference sequences. The tree for G3a contained 106 sequences from study participants and 98 reference sequences. Trees were inferred separately using RAxML with the GTR+G nucleotide substitution model. Participants in pairs (n = 2, yellow) and clusters (n > 2, green) are differentiated from non-clustered study participants (blue) and reference sequences (black) using ClusterPicker with a bootstrap threshold of ≥90% and genetic distance cut off of ≤5%. Large clades containing only reference sequences were collapsed. Scale bars indicate nucleotide substitutions per site. Clusters and pairs are numbered (bubbles are colour coded to represent either cluster [green] or pair [yellow]) and this corresponds to the clusters and pairs represented in Figure 4.

