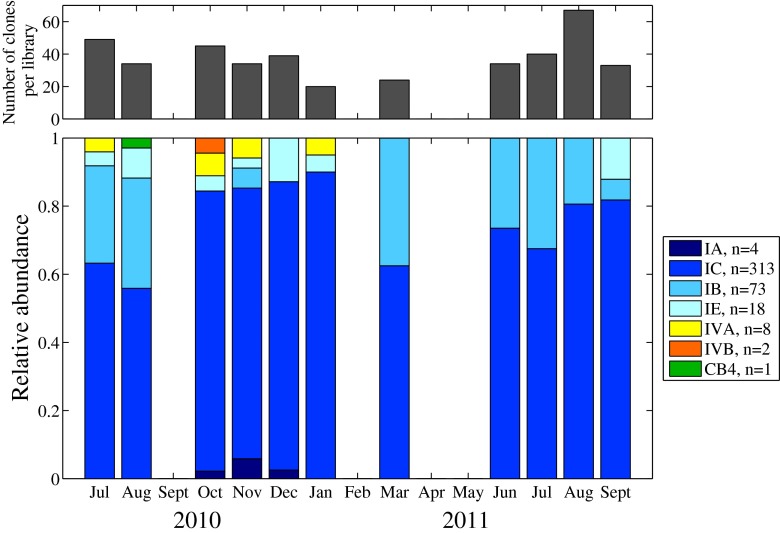
Fig. 6.
Relative abundance of ntcA clone library sequences belonging to 7 distinct OTUs for 11 samples taken between July 2010 and September 2011. Shades of blue indicate OTUs that belong to clade I, orange/yellow indicate OTUs that belong to clade IV, and green indicates the OTU that belongs to clade CB4. In the legend, n indicates total number of sequences retrieved for each OTU over the entire time series.The number of sequences retrieved for each library are indicated by the histogram in the top panel

