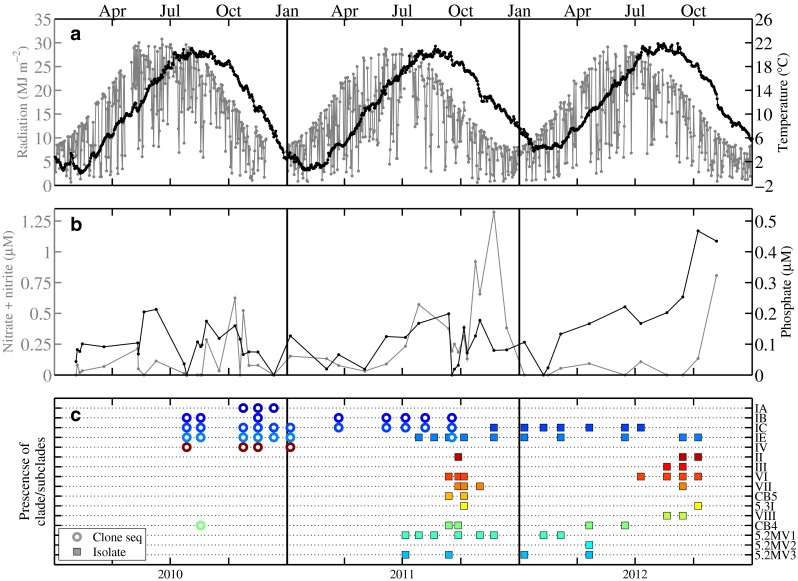
Fig. 7.

a Incident radiation (MJ m−2) (gray line) and water temperature (°C) at 4 m depth (black line) for 2010–2012. b Concentration of nitrate + nitrite (µM)(gray line) and inorganic phosphate (µM)(black line). c Occurrence of each clade in either clone library or enrichment for 2010–2012. Colors represent different clades or subclades, also separated on different lines. Clades detected by clone library sequence are designated by an open circle, while an isolate representative is designated by a filled square. Note that both clone library data and culture isolation data are only available for one sample
