Fig. 1.
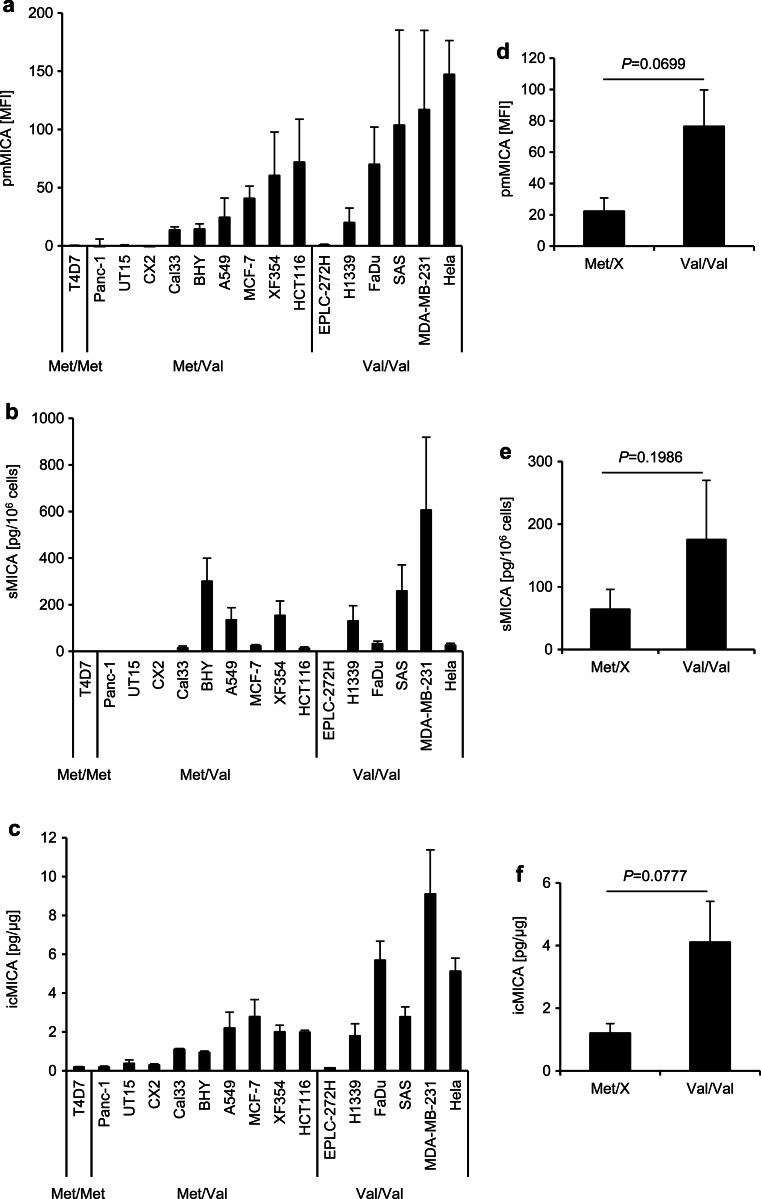
MICA expression on the plasma membrane and release of sMICA in human tumor cell lines with different MICA-129 genotypes. a The expression of pmMICA on human tumor cell lines carrying the different MICA-129 genotypes (Met/Met, Met/Val, and Val/Val) was analyzed by flow cytometry. The mean fluorescence intensities (MFI) of pmMICA are displayed as means plus standard deviation (SD) (n ≥ 5). b In parallel, the amounts of soluble MICA (sMICA) in the supernatants were determined by ELISA and are shown as means plus SD of sMICA (pg/106 cells). c The intracellular MICA (icMICA) was determined by ELISA and is shown as means plus SD. d–f The data were grouped according to the MICA-129 genotype, and cell lines carrying one or two MICA-129Met alleles (Met/X, i.e., Met/Met and Met/Val) were compared to cell lines which were homozygous for the MICA-129Val allele. The data are shown as means plus standard error of the mean (SEM) and they were analyzed by t tests

