Fig. 4.
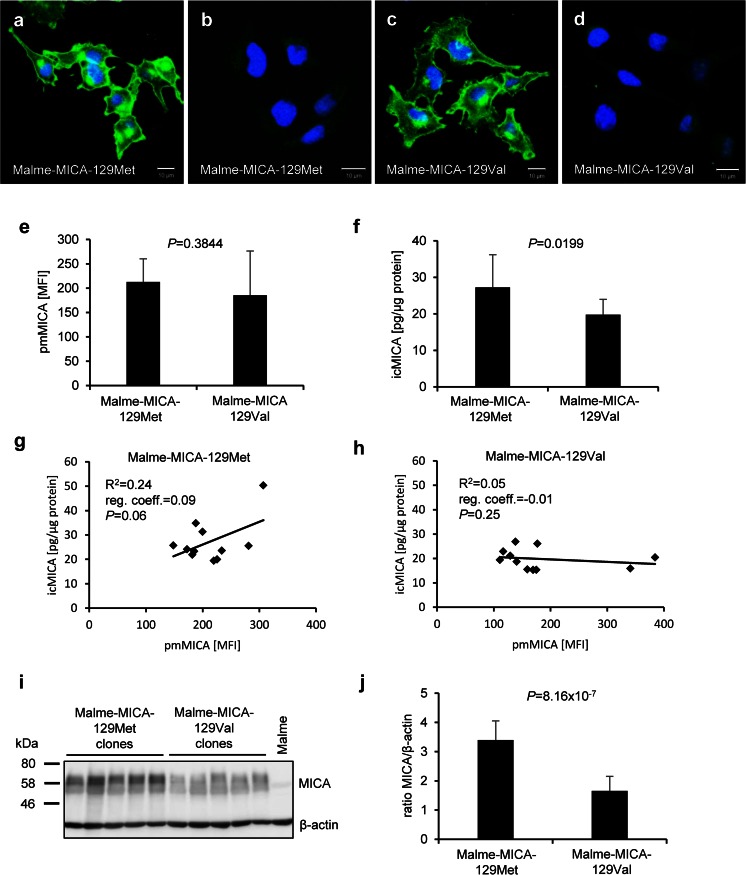
MICA expression on the plasma membrane and in intracellular compartments of Malme cells expressing the MICA-129Met or MICA-129Val isoform. a Confocal microscopy images show pmMICA and icMICA in a Malme-MICA-129Met clone after staining with an anti-MICA plus secondary Ab (green). Nuclei are stained with Hoechst 33342 (blue). The scale bar represents 10 μm. b The control illustrates the staining with the secondary Ab only. c A Malme-MICA-129Val clone is displayed after staining with an anti-MICA plus secondary Ab (green). d The control illustrates the staining with the secondary Ab only. e The pmMICA expression intensity on Malme-MICA-129Met (n = 11) and Malme-MICA-129Val clones (n = 11) is summarized as mean plus SD. The data were compared by a t test. f In parallel, the amounts of intracellular MICA (icMICA) were determined by ELISA and are shown as means plus SD. The data were compared by a t test. The linear regressions of icMICA and pmMICA are displayed for the g Malme-MICA-129Met and h Malme-MICA-129Val clones. The coefficient of determination (R 2), the regression coefficient (reg. coeff.), and the P value (for the Pearson correlation) are indicated for both MICA variants. i An immunoblot is shown on which lysates of five Malme-MICA-129Met clones, five Malme-MICA-129Val clones, and parental Malme cells were probed with anti-MICA and, as loading control, anti-β-actin Abs. The bands of a protein size marker are indicated at the left side. MICA bands are broad due to variations of glycosylation. j Immunoblots were analyzed by densitometry, and a summary of MICA/β-actin ratios of Malme-MICA-129Met (n = 11) and Malme-MICA-129Val (n = 11) clones is displayed as means plus SD. The data were compared by a t test

